Home
HomeQwen Streamlines Resume, PPT, and Data Cleaning into a Replicable AI Workflow
Resumes that vanish into thin air, the headache of staring at a blank report document, and the confusion of a messy sales table—these are everyday stressors for professionals. Yesterday, Qwen APP demonstrated how to tackle these scenarios live in Wuhan.
This AI-powered job-hunting workshop, guided by the Wuhan Human Resources and Social Security Bureau and hosted by Qwen APP and Wuhan Release, moved beyond dry theory. It walked on-site job seekers and fresh graduates through three practical tasks: resume diagnosis, business report writing, and sales table analysis, using AI step by step. The goal was to transform raw materials into polished documents, not just add more text. Jin Shixing, Qwen APP's product manager, framed the value of AI documents this way, setting the tone for the session.
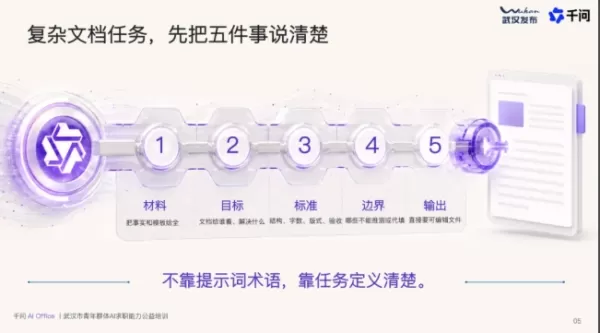
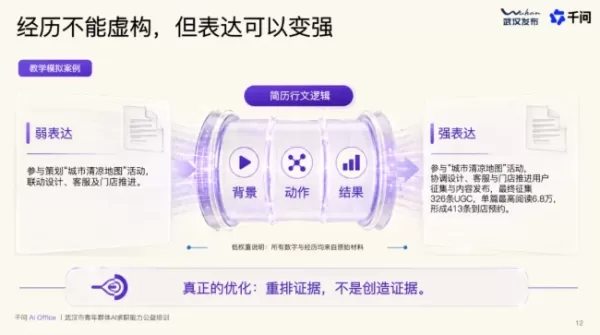
For resume writing, Qwen recommends clarifying five key points: provide all materials, state the goal, define standards, set boundaries, and request an editable file. Many people simply ask for "help writing a paragraph," but crafting a strong resume requires treating scattered experiences as raw materials. Use the target job's requirements as a benchmark, then work backward to highlight relevant facts. Transform a vague statement like "participated in organizing an event" into a compelling narrative with context, actions, and results, boosting its persuasive power.
Qwen also introduced a three-step prompt template that can be used directly. The first step is purely diagnostic: let the AI read the attached resume without rewriting it. Instead, summarize the job description into no more than seven core requirements, ranked by importance. Then create a five-column comparison table: core job requirements, existing evidence in the resume, strength of evidence, gaps or unconfirmed information, and suggested actions. Any information not present in the attachment should be marked as "not provided" to avoid speculation or fabrication. Finally, provide three most urgent revision suggestions.
The second step is to rewrite based on factual information. Only use real content from the original resume, rewriting personal summaries and work experience into action, methods, and results structures. Keep each section to three to four points, and keep each point to no more than 65 Chinese characters. Mark any evidence not in the material as "to be supplemented" and include a comparison table showing the modified content and its factual sources for user verification. The third step is to generate a formatted Word resume. There are clear rules for file names, margins, font size, line spacing, and module title styles. After generation, it requires self-checking for page breaks, fonts, and punctuation.
Being given a stack of unfamiliar files and asked to create a PowerPoint presentation on short notice is another workplace nightmare. Qwen APP's product manager, Jingjing, demonstrated a three-step emergency solution. First, establish the context of the task by clearly explaining four background elements: objective and theme, presenter and audience, supporting materials, and presentation format. For instance, when reporting on short drama transformation research to a team leader, specify the core conclusion—that short dramas are a key breakthrough direction—the planner's role, why the report focuses on suitability for self-media transformation, how to quickly gain traction, and the monetization path, along with the format of 15 slides for a 15-minute presentation. Second, let the AI read all files, summarize them, then restructure the content based on the speaker's department responsibilities and recent business priorities to generate a draft. Third, use Qwen's four skill kits to fine-tune and personalize the PPT.
The toughest part is using AI to extract key metrics from messy data. Jin Shixing demonstrated a fictional tea shop operations case, walking through the entire process of building, organizing, calculating, analyzing, and presenting. Given a raw sales detail sheet, first clean up the messy data while preserving the original table, unify naming formats, then input formulas to calculate gross profit and gross margin. This provides a foundation for business review. Finally, a sales table with 486 rows of messy data is condensed into a single clear PPT page with obvious conclusions.
The accompanying six-step data analysis prompt words break down this methodology in detail. The first step is to set up an analysis workspace: process only the uploaded files, do not supplement with online information or speculate on missing facts, retain the original data, and ensure all conclusions can be traced back to the data and calculation methods in the table. Create five workbooks: cleaned data, data processing log, indicator summary, business report, and definition explanation. Set filters, freeze headers, and standardize formats.
The second step is to clean the original data: unify the aliases of three stores and four channels, standardize product names, convert dates to YYYY-MM-DD, transform amounts with currency symbols or text formats into numbers, delete completely duplicate records, mark missing items as "to be confirmed" instead of guessing, and output the number of rows before and after processing, the count of various issues, and pending confirmations.
The third step is to enter traceable formulas: use Excel formulas rather than static results to populate standard sales, product cost, gross profit, gross margin, discount rate, average revenue per cup, and date type indicators. Handle division by zero and missing values carefully, retain two decimal places for amounts and one decimal place for ratios, simultaneously record indicator definitions in the definition explanation, and generate a general verification table.
The fourth step is to perform business analysis using natural language: summarize by store, product, channel, and time period, answering questions like which store has the largest scale, whether the highest sales also imply the highest gross profit, which channel has high volume but low gross profit, and which two periods contribute the most revenue. Each conclusion should list the data, the comparison object, and the calculation basis, and remind not to generalize hypothetical samples into long-term trends.
The fifth step is to generate a one-page business report: display key indicators at the top, produce four charts—store revenue comparison, product cup count and gross profit comparison, channel gross profit comparison, and time period revenue comparison. Each chart title should directly convey the main finding rather than using vague titles. Below each chart, list three data insights and three action recommendations. The sixth step is for the data auditor to perform a final check: verify the number of rows before and after cleaning, whether all summaries equal the total, whether formulas cover everything, whether percentage denominators are consistent, whether charts are misleading, and whether conclusions exceed the data range. Output a four-column list of checking items, results, evidence, and matters requiring manual confirmation, without directly modifying the data.
Related article
 Musk Admits Grok Build Leaked User Code, Promises to Erase All Historical Data
Elon Musk directly addressed the privacy controversy surrounding Grok Build, beginning with a simple "True" to confirm the incident's validity. He pledged that all user data previously uploaded to SpaceXAI would be permanently erased, stating, "not a
U.S. Stocks Hit Historic Milestone as AI and Aerospace Giants Prepare for Trillion-Dollar Debut
Elon Musk, Sam Altman, and Dario Amodei, three titans of the technology sector, are advancing toward initial public offerings for their respective ventures. With SpaceX, OpenAI, and Anthropic—three industry behemoths nearing trillion-dollar valuation
Swedish AI Startup Lovable Eyes $13.2 Billion Valuation After Major Funding Round
As AI-driven coding tools gain traction, Swedish startup Lovable has secured a major funding round. The company aims to raise $3 billion, potentially boosting its valuation to $13.2 billion—double the $6.6 billion recorded last December. Menlo Ventur
Related Special Topic Recommendations
SEO
Musk Admits Grok Build Leaked User Code, Promises to Erase All Historical Data
Elon Musk directly addressed the privacy controversy surrounding Grok Build, beginning with a simple "True" to confirm the incident's validity. He pledged that all user data previously uploaded to SpaceXAI would be permanently erased, stating, "not a
U.S. Stocks Hit Historic Milestone as AI and Aerospace Giants Prepare for Trillion-Dollar Debut
Elon Musk, Sam Altman, and Dario Amodei, three titans of the technology sector, are advancing toward initial public offerings for their respective ventures. With SpaceX, OpenAI, and Anthropic—three industry behemoths nearing trillion-dollar valuation
Swedish AI Startup Lovable Eyes $13.2 Billion Valuation After Major Funding Round
As AI-driven coding tools gain traction, Swedish startup Lovable has secured a major funding round. The company aims to raise $3 billion, potentially boosting its valuation to $13.2 billion—double the $6.6 billion recorded last December. Menlo Ventur
Related Special Topic Recommendations
SEO
 Best AI SERP Analysis Tools for Search Strategy
2026 Latest Best Top-rated AI SERP Analysis Tools for Search Strategy are curated by XIX.AI through rigorous real-world tests and weekly updated rankings. These powerful tools help you unlock hidden optimization opportunities, boost content performance, and gain a competitive edge in search. Discover your perfect tool to elevate your search strategy today. Explore now!
 13 tools
 xix.ai
Data Analysis
Best AI Anomaly Detection Tools for KPI Monitoring across SaaS and Ecommerce Teams
xix.ai
Data Analysis
Best AI Anomaly Detection Tools for KPI Monitoring across SaaS and Ecommerce Teams
2026 Latest Best Top-rated AI Anomaly Detection Tools for KPI Monitoring in SaaS and Ecommerce teams! XIX.AI has curated a powerful, game-changing collection based on rigorous real-world tests and weekly updated rankings. You’ll find detailed free vs paid comparison insights to help you identify the must-try solution that boosts productivity and unlocks your AI edge. Explore now!
10 tools
xix.ai
writing
Best AI Outline Generators for Long-Form SEO Articles
2026 Latest Best Top-Rated AI Outline Generators for Long-Form SEO Articles, meticulously curated by XIX.AI. These powerful tools offer game-changing assistance in creating high-quality content quickly, boosting writing efficiency significantly. Get a free vs paid comparison along with real-world tests and detailed rankings to help you find the must-try option that suits your needs. Explore now to unlock your AI edge.
8 tools
xix.ai
Education and Learning
AI Study Tools for Homework and Exam Prep
2026 Latest Best AI Study Tools for Homework and Exam Prep! XIX.AI curates a top-rated list of powerful, game-changing tools that help students boost productivity, streamline homework completion, and ace exams through real-world tests. Get a free vs paid comparison, detailed rankings, and must-try options to unlock your AI edge. Explore now!
10 tools
xix.ai
Music composition
AI Vocal Demo Tools for Songwriters, Hooks, Toplines, and Multilingual Draft Sessions
2026 Latest Best AI Vocal Demo Tools for Songwriters, Hook Creators, and Multi-Language Content Teams! XIX.AI has curated a top-rated list of powerful game-changing tools that go through rigorous real-world tests. You’ll find detailed free vs paid comparison data, comprehensive rankings, and must-try options to help you boost writing efficiency and unlock your creative potential. Explore now to discover your perfect tool for all your content needs!
9 tools
xix.ai
Business
Best AI Competitive Research Tools for Small Businesses
2026 Latest Best Top-rated AI Competitive Research Tools for Small Businesses! XIX.AI has curated a highly powerful game-changing collection, updated weekly with rigorous real-world tests and detailed rankings. You can find a comprehensive free vs paid comparison to help you identify the must-try tools that boost your productivity and give you a competitive edge. Explore now to discover your perfect tool!
9 tools
xix.ai

 Comments (0)
0/500
Comments (0)
0/500
Resumes that vanish into thin air, the headache of staring at a blank report document, and the confusion of a messy sales table—these are everyday stressors for professionals. Yesterday, Qwen APP demonstrated how to tackle these scenarios live in Wuhan.
This AI-powered job-hunting workshop, guided by the Wuhan Human Resources and Social Security Bureau and hosted by Qwen APP and Wuhan Release, moved beyond dry theory. It walked on-site job seekers and fresh graduates through three practical tasks: resume diagnosis, business report writing, and sales table analysis, using AI step by step. The goal was to transform raw materials into polished documents, not just add more text. Jin Shixing, Qwen APP's product manager, framed the value of AI documents this way, setting the tone for the session.
For resume writing, Qwen recommends clarifying five key points: provide all materials, state the goal, define standards, set boundaries, and request an editable file. Many people simply ask for "help writing a paragraph," but crafting a strong resume requires treating scattered experiences as raw materials. Use the target job's requirements as a benchmark, then work backward to highlight relevant facts. Transform a vague statement like "participated in organizing an event" into a compelling narrative with context, actions, and results, boosting its persuasive power.
Qwen also introduced a three-step prompt template that can be used directly. The first step is purely diagnostic: let the AI read the attached resume without rewriting it. Instead, summarize the job description into no more than seven core requirements, ranked by importance. Then create a five-column comparison table: core job requirements, existing evidence in the resume, strength of evidence, gaps or unconfirmed information, and suggested actions. Any information not present in the attachment should be marked as "not provided" to avoid speculation or fabrication. Finally, provide three most urgent revision suggestions.
The second step is to rewrite based on factual information. Only use real content from the original resume, rewriting personal summaries and work experience into action, methods, and results structures. Keep each section to three to four points, and keep each point to no more than 65 Chinese characters. Mark any evidence not in the material as "to be supplemented" and include a comparison table showing the modified content and its factual sources for user verification. The third step is to generate a formatted Word resume. There are clear rules for file names, margins, font size, line spacing, and module title styles. After generation, it requires self-checking for page breaks, fonts, and punctuation.
Being given a stack of unfamiliar files and asked to create a PowerPoint presentation on short notice is another workplace nightmare. Qwen APP's product manager, Jingjing, demonstrated a three-step emergency solution. First, establish the context of the task by clearly explaining four background elements: objective and theme, presenter and audience, supporting materials, and presentation format. For instance, when reporting on short drama transformation research to a team leader, specify the core conclusion—that short dramas are a key breakthrough direction—the planner's role, why the report focuses on suitability for self-media transformation, how to quickly gain traction, and the monetization path, along with the format of 15 slides for a 15-minute presentation. Second, let the AI read all files, summarize them, then restructure the content based on the speaker's department responsibilities and recent business priorities to generate a draft. Third, use Qwen's four skill kits to fine-tune and personalize the PPT.
The toughest part is using AI to extract key metrics from messy data. Jin Shixing demonstrated a fictional tea shop operations case, walking through the entire process of building, organizing, calculating, analyzing, and presenting. Given a raw sales detail sheet, first clean up the messy data while preserving the original table, unify naming formats, then input formulas to calculate gross profit and gross margin. This provides a foundation for business review. Finally, a sales table with 486 rows of messy data is condensed into a single clear PPT page with obvious conclusions.
The accompanying six-step data analysis prompt words break down this methodology in detail. The first step is to set up an analysis workspace: process only the uploaded files, do not supplement with online information or speculate on missing facts, retain the original data, and ensure all conclusions can be traced back to the data and calculation methods in the table. Create five workbooks: cleaned data, data processing log, indicator summary, business report, and definition explanation. Set filters, freeze headers, and standardize formats.
The second step is to clean the original data: unify the aliases of three stores and four channels, standardize product names, convert dates to YYYY-MM-DD, transform amounts with currency symbols or text formats into numbers, delete completely duplicate records, mark missing items as "to be confirmed" instead of guessing, and output the number of rows before and after processing, the count of various issues, and pending confirmations.
The third step is to enter traceable formulas: use Excel formulas rather than static results to populate standard sales, product cost, gross profit, gross margin, discount rate, average revenue per cup, and date type indicators. Handle division by zero and missing values carefully, retain two decimal places for amounts and one decimal place for ratios, simultaneously record indicator definitions in the definition explanation, and generate a general verification table.
The fourth step is to perform business analysis using natural language: summarize by store, product, channel, and time period, answering questions like which store has the largest scale, whether the highest sales also imply the highest gross profit, which channel has high volume but low gross profit, and which two periods contribute the most revenue. Each conclusion should list the data, the comparison object, and the calculation basis, and remind not to generalize hypothetical samples into long-term trends.
The fifth step is to generate a one-page business report: display key indicators at the top, produce four charts—store revenue comparison, product cup count and gross profit comparison, channel gross profit comparison, and time period revenue comparison. Each chart title should directly convey the main finding rather than using vague titles. Below each chart, list three data insights and three action recommendations. The sixth step is for the data auditor to perform a final check: verify the number of rows before and after cleaning, whether all summaries equal the total, whether formulas cover everything, whether percentage denominators are consistent, whether charts are misleading, and whether conclusions exceed the data range. Output a four-column list of checking items, results, evidence, and matters requiring manual confirmation, without directly modifying the data.








 Musk Admits Grok Build Leaked User Code, Promises to Erase All Historical Data
Elon Musk directly addressed the privacy controversy surrounding Grok Build, beginning with a simple "True" to confirm the incident's validity. He pledged that all user data previously uploaded to SpaceXAI would be permanently erased, stating, "not a
Musk Admits Grok Build Leaked User Code, Promises to Erase All Historical Data
Elon Musk directly addressed the privacy controversy surrounding Grok Build, beginning with a simple "True" to confirm the incident's validity. He pledged that all user data previously uploaded to SpaceXAI would be permanently erased, stating, "not a
 U.S. Stocks Hit Historic Milestone as AI and Aerospace Giants Prepare for Trillion-Dollar Debut
Elon Musk, Sam Altman, and Dario Amodei, three titans of the technology sector, are advancing toward initial public offerings for their respective ventures. With SpaceX, OpenAI, and Anthropic—three industry behemoths nearing trillion-dollar valuation
U.S. Stocks Hit Historic Milestone as AI and Aerospace Giants Prepare for Trillion-Dollar Debut
Elon Musk, Sam Altman, and Dario Amodei, three titans of the technology sector, are advancing toward initial public offerings for their respective ventures. With SpaceX, OpenAI, and Anthropic—three industry behemoths nearing trillion-dollar valuation
 Swedish AI Startup Lovable Eyes $13.2 Billion Valuation After Major Funding Round
As AI-driven coding tools gain traction, Swedish startup Lovable has secured a major funding round. The company aims to raise $3 billion, potentially boosting its valuation to $13.2 billion—double the $6.6 billion recorded last December. Menlo Ventur
Swedish AI Startup Lovable Eyes $13.2 Billion Valuation After Major Funding Round
As AI-driven coding tools gain traction, Swedish startup Lovable has secured a major funding round. The company aims to raise $3 billion, potentially boosting its valuation to $13.2 billion—double the $6.6 billion recorded last December. Menlo Ventur

2026 Latest Best Top-rated AI SERP Analysis Tools for Search Strategy are curated by XIX.AI through rigorous real-world tests and weekly updated rankings. These powerful tools help you unlock hidden optimization opportunities, boost content performance, and gain a competitive edge in search. Discover your perfect tool to elevate your search strategy today. Explore now!
13 tools
xix.ai

2026 Latest Best Top-rated AI Anomaly Detection Tools for KPI Monitoring in SaaS and Ecommerce teams! XIX.AI has curated a powerful, game-changing collection based on rigorous real-world tests and weekly updated rankings. You’ll find detailed free vs paid comparison insights to help you identify the must-try solution that boosts productivity and unlocks your AI edge. Explore now!
10 tools
xix.ai

2026 Latest Best Top-Rated AI Outline Generators for Long-Form SEO Articles, meticulously curated by XIX.AI. These powerful tools offer game-changing assistance in creating high-quality content quickly, boosting writing efficiency significantly. Get a free vs paid comparison along with real-world tests and detailed rankings to help you find the must-try option that suits your needs. Explore now to unlock your AI edge.
8 tools
xix.ai

2026 Latest Best AI Study Tools for Homework and Exam Prep! XIX.AI curates a top-rated list of powerful, game-changing tools that help students boost productivity, streamline homework completion, and ace exams through real-world tests. Get a free vs paid comparison, detailed rankings, and must-try options to unlock your AI edge. Explore now!
10 tools
xix.ai

2026 Latest Best AI Vocal Demo Tools for Songwriters, Hook Creators, and Multi-Language Content Teams! XIX.AI has curated a top-rated list of powerful game-changing tools that go through rigorous real-world tests. You’ll find detailed free vs paid comparison data, comprehensive rankings, and must-try options to help you boost writing efficiency and unlock your creative potential. Explore now to discover your perfect tool for all your content needs!
9 tools
xix.ai

2026 Latest Best Top-rated AI Competitive Research Tools for Small Businesses! XIX.AI has curated a highly powerful game-changing collection, updated weekly with rigorous real-world tests and detailed rankings. You can find a comprehensive free vs paid comparison to help you identify the must-try tools that boost your productivity and give you a competitive edge. Explore now to discover your perfect tool!
9 tools
xix.ai