Home
HomeHow to test and optimize website speed in 2025 for peak performance?
In today's digital world, fast website performance is non-negotiable. Users demand quick interactions, and search engines reward sites that deliver them. A slow-loading site frustrates visitors, increases bounce rates, and damages your bottom line. This guide explores the critical process of website speed testing and analysis, offering practical strategies to optimize your site for peak performance and a superior user experience.
Key Points
Website speed is a direct driver of user experience and search engine rankings.
Performance analysis tools deliver essential data for effective website optimization.
Key metrics to track include Largest Contentful Paint (LCP), Total Blocking Time (TBT), and Cumulative Layout Shift (CLS).
Improving speed involves optimizing images, enabling compression, and streamlining code.
Consistent testing and analysis are vital for maintaining high performance.
Understanding Website Speed and Analysis
Why Website Speed Matters
Website speed is crucial for user satisfaction, SEO success, and achieving your online goals. A fast site keeps users engaged, lowers bounce rates, and boosts conversions. Slow loading, conversely, leads to frustration, visitor loss, and a tarnished brand image.
From an SEO perspective, search engines like Google use page speed as a ranking factor. Faster sites gain an advantage in search results, leading to greater organic traffic and visibility. Therefore, optimizing your site's speed is essential for both attracting visitors and pleasing search engines.
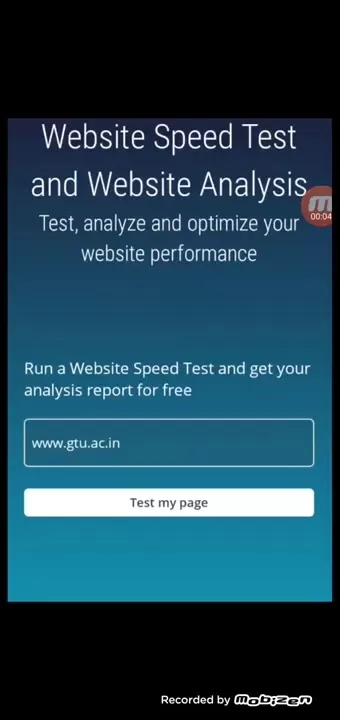
Core Web Vitals are the specific user experience metrics Google prioritizes and are intrinsically linked to your site's speed.
- Largest Contentful Paint (LCP): Measures loading speed.
- First Input Delay (FID): Measures interactivity.
- Cumulative Layout Shift (CLS): Measures visual stability.
Maintaining strong performance in these areas ensures a user-friendly website that keeps visitors happy and engaged.
Introducing Webpage Analyzers
Webpage analyzers are specialized tools that perform a thorough performance checkup on your website, delivering detailed data and actionable optimization advice. They evaluate critical aspects like load speed, page weight, resource requests, and code efficiency. By pinpointing performance bottlenecks, these tools empower you to enhance your site and deliver a superior user experience.
A typical analyzer's report provides a clear breakdown of:
- What's working well: Highlighting your site's current strengths.
- What needs improvement: Identifying the specific issues hampering your speed.
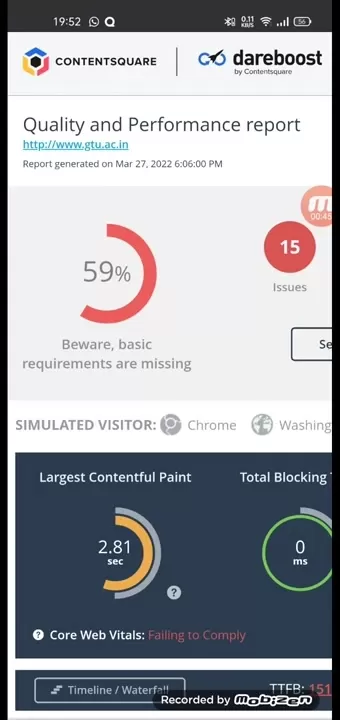
Interpreting these findings and implementing the recommended fixes is the key to unlocking better website performance.
Deep Dive into Key Performance Metrics
Largest Contentful Paint (LCP): The User's First Impression
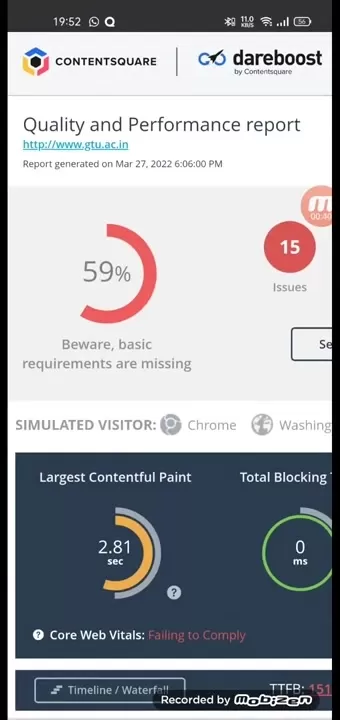
Largest Contentful Paint, or LCP, measures how long it takes for the main content element (like a hero image or headline) to appear on screen. This metric shapes the user's initial perception of speed. An LCP under 2.5 seconds is considered good, while anything over 4 seconds requires urgent attention.
To optimize your LCP:
- Optimize images: Compress and resize images efficiently to reduce their file size.
- Implement a Content Delivery Network (CDN): Serve your site's assets from servers geographically closer to your visitors.
- Minify CSS and JavaScript: Remove unnecessary characters from code files to speed up their download and parsing.
Total Blocking Time (TBT): Ensuring a Smooth User Experience
Total Blocking Time, or TBT, quantifies the total period during page load when the browser is too busy to respond to user input. A high TBT leads to a sluggish, unresponsive experience. Aim for a TBT below 300 milliseconds for optimal smoothness.
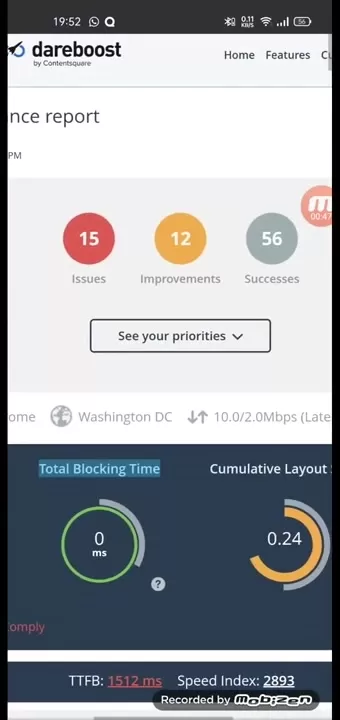
To reduce your TBT:
- Streamline JavaScript: Optimize and defer non-critical JavaScript to free up the main thread.
- Leverage browser caching: Instruct browsers to store static assets locally, so returning visitors load your site faster.
- Audit third-party scripts: Evaluate and remove any non-essential or poorly performing third-party code.
Cumulative Layout Shift (CLS): Maintaining Visual Stability
Cumulative Layout Shift, or CLS, measures unexpected movement of page elements as it loads. High CLS is disruptive, causing users to misclick or lose their reading place. Strive for a CLS score below 0.1 for a stable and predictable visual experience.
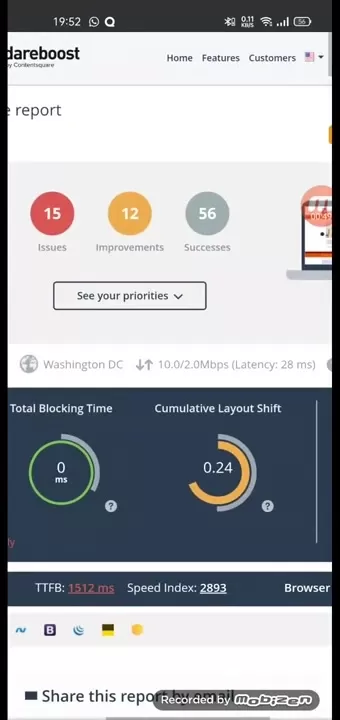
To improve your CLS score:
- Define dimensions for media: Always specify width and height attributes for images and videos.
- Reserve space for dynamic content: Allocate space for elements like ads or embeds so they don't push content down when they load.
- Avoid injecting content above existing content: Adding new elements above existing ones forces the layout to shift, disrupting the user.
Performing a Website Speed Test: A Step-by-Step Guide
Selecting a Webpage Analyzer
A variety of webpage analyzers are available, each with unique features. Popular and reliable options include:
- Dareboost: Offers in-depth reports with clear, actionable recommendations.
- Google PageSpeed Insights: Provides performance scores and suggestions for both mobile and desktop.
- GTmetrix: A comprehensive tool for detailed analysis, offering performance reports and historical tracking.
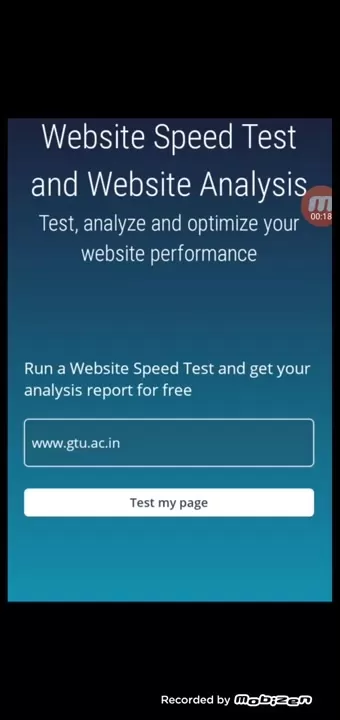
Choose a tool that aligns with your specific needs and provides the insights required to improve your site. For example, Dareboost delivers reports that clearly outline performance scores, identify issues, and highlight successes.
Inputting Your Website URL
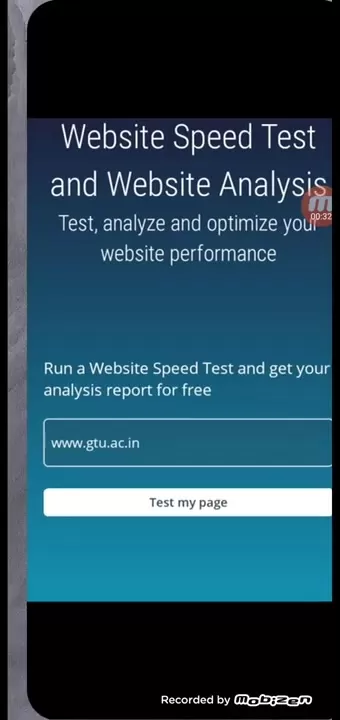
Once you've chosen a tool, simply enter your website's full address (URL) into the provided field. The analyzer will then scan your site and generate a performance report.
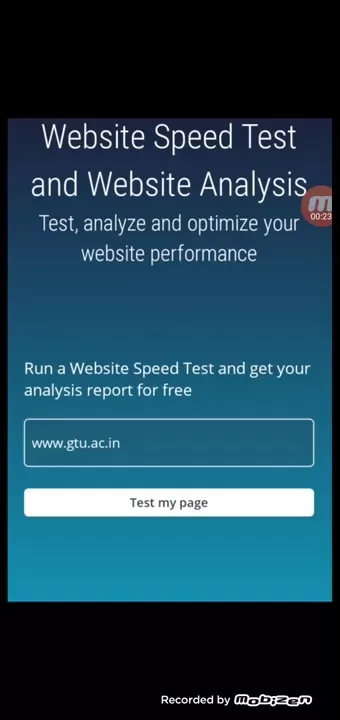
To ensure the most accurate test, use the exact URL that visitors see, including the 'www' prefix if your site uses it.
Analyzing the Results
After the scan, you will receive a detailed report. Review it carefully, focusing on the key metrics (LCP, TBT, CLS) and the specific recommendations. Identify both your strengths and the areas needing improvement.
Pay special attention to sections labeled 'Opportunities' or 'Items to Fix.' These provide direct, actionable steps you or your developer can take to accelerate your site.
Below is an example structure of a typical performance analysis report:
Dareboost - Pros
and Cons
Pros
Comprehensive analysis: Dareboost delivers in-depth insights into speed, SEO, and accessibility.
Actionable advice: The tool provides clear, practical recommendations for improvement.
User-friendly interface: The dashboard is intuitive and easy to navigate for users of all levels.
Performance monitoring: It allows you to track your site's performance over time to gauge progress.
Cons
Cost: Subscription plans may be expensive for small businesses or individual site owners.
Information overload: The detailed reports can be overwhelming for beginners.
Limited free tier: The features available in the free plan are restricted.
FAQ
How often should I test my website speed?
Test your website speed regularly—at least once a month—and whenever you make significant updates. This proactive approach helps you catch performance issues early and maintain an optimal experience.
What is a good website speed score?
A good score varies by tool, but generally, aim for a score above 80-90 on Google PageSpeed Insights or a full load time under 3 seconds on tools like GTmetrix.
What are some common causes of slow website speed?
Common culprits include:Unoptimized, heavy images.Excessively large CSS and JavaScript files.Too many HTTP requests.Slow server response times.Not using browser caching effectively.
Related Questions
How can I optimize images for faster loading times?
Optimize images by:Compressing them: Use tools like TinyPNG, ShortPixel, or ImageOptim to reduce file size while preserving quality.Choosing the correct format: Use JPEG for photos, PNG for graphics with transparency, and consider modern formats like WebP.Resizing them: Ensure images are no larger than the dimensions at which they'll be displayed on the page.Implementing lazy loading: Delay loading off-screen images until a user scrolls near them.These practices drastically improve load times and user experience, and also help prevent layout shifts (CLS).
What are the benefits of using a Content Delivery Network (CDN)?
A Content Delivery Network (CDN) provides several key benefits:Faster global delivery: By serving content from servers near your users, a CDN significantly reduces load times worldwide.Enhanced reliability: CDNs provide redundancy, keeping your site online even if one server has an issue.Reduced origin server load: Offloading traffic to the CDN improves the stability and responsiveness of your main server.SEO advantage: Faster loading times contribute positively to search engine rankings.Using a CDN is a highly effective strategy for improving speed and user satisfaction across the globe.
How can I minify CSS and JavaScript files?
You can minify CSS and JavaScript using online tools (like minifycode.com) or build automation tools (like Webpack, Gulp). These processes remove unnecessary whitespace, comments, and line breaks, reducing file size for faster downloads. For WordPress users, plugins like Autoptimize can handle this automatically. Always test your site after minification to ensure no functionality is broken.
Related article
 U.S. Stocks Hit Historic Milestone as AI and Aerospace Giants Prepare for Trillion-Dollar Debut
Elon Musk, Sam Altman, and Dario Amodei, three titans of the technology sector, are advancing toward initial public offerings for their respective ventures. With SpaceX, OpenAI, and Anthropic—three industry behemoths nearing trillion-dollar valuation
Swedish AI Startup Lovable Eyes $13.2 Billion Valuation After Major Funding Round
As AI-driven coding tools gain traction, Swedish startup Lovable has secured a major funding round. The company aims to raise $3 billion, potentially boosting its valuation to $13.2 billion—double the $6.6 billion recorded last December. Menlo Ventur
Google Tests Remy AI Agent for Gemini as Focus Shifts to User Control
According to Business Insider, Google is testing Remy, a new AI personal agent for Gemini. This tool aims to execute tasks on behalf of users, streamlining both professional workflows and daily routines.Currently, Remy is undergoing testing in an int
Related Special Topic Recommendations
SEO
U.S. Stocks Hit Historic Milestone as AI and Aerospace Giants Prepare for Trillion-Dollar Debut
Elon Musk, Sam Altman, and Dario Amodei, three titans of the technology sector, are advancing toward initial public offerings for their respective ventures. With SpaceX, OpenAI, and Anthropic—three industry behemoths nearing trillion-dollar valuation
Swedish AI Startup Lovable Eyes $13.2 Billion Valuation After Major Funding Round
As AI-driven coding tools gain traction, Swedish startup Lovable has secured a major funding round. The company aims to raise $3 billion, potentially boosting its valuation to $13.2 billion—double the $6.6 billion recorded last December. Menlo Ventur
Google Tests Remy AI Agent for Gemini as Focus Shifts to User Control
According to Business Insider, Google is testing Remy, a new AI personal agent for Gemini. This tool aims to execute tasks on behalf of users, streamlining both professional workflows and daily routines.Currently, Remy is undergoing testing in an int
Related Special Topic Recommendations
SEO
 Best AI SERP Analysis Tools for Search Strategy
2026 Latest Best Top-rated AI SERP Analysis Tools for Search Strategy are curated by XIX.AI through rigorous real-world tests and weekly updated rankings. These powerful tools help you unlock hidden optimization opportunities, boost content performance, and gain a competitive edge in search. Discover your perfect tool to elevate your search strategy today. Explore now!
 13 tools
 xix.ai
Data Analysis
Best AI Anomaly Detection Tools for KPI Monitoring across SaaS and Ecommerce Teams
xix.ai
Data Analysis
Best AI Anomaly Detection Tools for KPI Monitoring across SaaS and Ecommerce Teams
2026 Latest Best Top-rated AI Anomaly Detection Tools for KPI Monitoring in SaaS and Ecommerce teams! XIX.AI has curated a powerful, game-changing collection based on rigorous real-world tests and weekly updated rankings. You’ll find detailed free vs paid comparison insights to help you identify the must-try solution that boosts productivity and unlocks your AI edge. Explore now!
10 tools
xix.ai
writing
Best AI Outline Generators for Long-Form SEO Articles
2026 Latest Best Top-Rated AI Outline Generators for Long-Form SEO Articles, meticulously curated by XIX.AI. These powerful tools offer game-changing assistance in creating high-quality content quickly, boosting writing efficiency significantly. Get a free vs paid comparison along with real-world tests and detailed rankings to help you find the must-try option that suits your needs. Explore now to unlock your AI edge.
8 tools
xix.ai
Education and Learning
AI Study Tools for Homework and Exam Prep
2026 Latest Best AI Study Tools for Homework and Exam Prep! XIX.AI curates a top-rated list of powerful, game-changing tools that help students boost productivity, streamline homework completion, and ace exams through real-world tests. Get a free vs paid comparison, detailed rankings, and must-try options to unlock your AI edge. Explore now!
10 tools
xix.ai
Music composition
AI Vocal Demo Tools for Songwriters, Hooks, Toplines, and Multilingual Draft Sessions
2026 Latest Best AI Vocal Demo Tools for Songwriters, Hook Creators, and Multi-Language Content Teams! XIX.AI has curated a top-rated list of powerful game-changing tools that go through rigorous real-world tests. You’ll find detailed free vs paid comparison data, comprehensive rankings, and must-try options to help you boost writing efficiency and unlock your creative potential. Explore now to discover your perfect tool for all your content needs!
9 tools
xix.ai
Business
Best AI Competitive Research Tools for Small Businesses
2026 Latest Best Top-rated AI Competitive Research Tools for Small Businesses! XIX.AI has curated a highly powerful game-changing collection, updated weekly with rigorous real-world tests and detailed rankings. You can find a comprehensive free vs paid comparison to help you identify the must-try tools that boost your productivity and give you a competitive edge. Explore now to discover your perfect tool!
9 tools
xix.ai

 Comments (2)
0/500
Comments (2)
0/500
![AlbertHarris]()
Just realized my site speed test results are basically a horror movie in graph form 🎬📉 Tempted to just throw more servers at it, but optimization tips here seem more sustainable. Anyone else find the Core Web Vitals changes in 2025 confusing?
![EricAllen]()
Je ne savais pas que la vitesse du site web avait un tel impact sur le taux de rebond 😮 C'est un peu effrayant de penser que quelques secondes de retard peuvent coûter des clients. Est-ce que les outils de test mentionnés sont adaptés aux petits sites e-commerce ?
In today's digital world, fast website performance is non-negotiable. Users demand quick interactions, and search engines reward sites that deliver them. A slow-loading site frustrates visitors, increases bounce rates, and damages your bottom line. This guide explores the critical process of website speed testing and analysis, offering practical strategies to optimize your site for peak performance and a superior user experience.
Key Points
Website speed is a direct driver of user experience and search engine rankings.
Performance analysis tools deliver essential data for effective website optimization.
Key metrics to track include Largest Contentful Paint (LCP), Total Blocking Time (TBT), and Cumulative Layout Shift (CLS).
Improving speed involves optimizing images, enabling compression, and streamlining code.
Consistent testing and analysis are vital for maintaining high performance.
Understanding Website Speed and Analysis
Why Website Speed Matters
Website speed is crucial for user satisfaction, SEO success, and achieving your online goals. A fast site keeps users engaged, lowers bounce rates, and boosts conversions. Slow loading, conversely, leads to frustration, visitor loss, and a tarnished brand image.
From an SEO perspective, search engines like Google use page speed as a ranking factor. Faster sites gain an advantage in search results, leading to greater organic traffic and visibility. Therefore, optimizing your site's speed is essential for both attracting visitors and pleasing search engines.
Core Web Vitals are the specific user experience metrics Google prioritizes and are intrinsically linked to your site's speed.
- Largest Contentful Paint (LCP): Measures loading speed.
- First Input Delay (FID): Measures interactivity.
- Cumulative Layout Shift (CLS): Measures visual stability.
Maintaining strong performance in these areas ensures a user-friendly website that keeps visitors happy and engaged.
Introducing Webpage Analyzers
Webpage analyzers are specialized tools that perform a thorough performance checkup on your website, delivering detailed data and actionable optimization advice. They evaluate critical aspects like load speed, page weight, resource requests, and code efficiency. By pinpointing performance bottlenecks, these tools empower you to enhance your site and deliver a superior user experience.
A typical analyzer's report provides a clear breakdown of:
- What's working well: Highlighting your site's current strengths.
- What needs improvement: Identifying the specific issues hampering your speed.
Interpreting these findings and implementing the recommended fixes is the key to unlocking better website performance.
Deep Dive into Key Performance Metrics
Largest Contentful Paint (LCP): The User's First Impression
Largest Contentful Paint, or LCP, measures how long it takes for the main content element (like a hero image or headline) to appear on screen. This metric shapes the user's initial perception of speed. An LCP under 2.5 seconds is considered good, while anything over 4 seconds requires urgent attention.
To optimize your LCP:
- Optimize images: Compress and resize images efficiently to reduce their file size.
- Implement a Content Delivery Network (CDN): Serve your site's assets from servers geographically closer to your visitors.
- Minify CSS and JavaScript: Remove unnecessary characters from code files to speed up their download and parsing.
Total Blocking Time (TBT): Ensuring a Smooth User Experience
Total Blocking Time, or TBT, quantifies the total period during page load when the browser is too busy to respond to user input. A high TBT leads to a sluggish, unresponsive experience. Aim for a TBT below 300 milliseconds for optimal smoothness.
To reduce your TBT:
- Streamline JavaScript: Optimize and defer non-critical JavaScript to free up the main thread.
- Leverage browser caching: Instruct browsers to store static assets locally, so returning visitors load your site faster.
- Audit third-party scripts: Evaluate and remove any non-essential or poorly performing third-party code.
Cumulative Layout Shift (CLS): Maintaining Visual Stability
Cumulative Layout Shift, or CLS, measures unexpected movement of page elements as it loads. High CLS is disruptive, causing users to misclick or lose their reading place. Strive for a CLS score below 0.1 for a stable and predictable visual experience.
To improve your CLS score:
- Define dimensions for media: Always specify width and height attributes for images and videos.
- Reserve space for dynamic content: Allocate space for elements like ads or embeds so they don't push content down when they load.
- Avoid injecting content above existing content: Adding new elements above existing ones forces the layout to shift, disrupting the user.
Performing a Website Speed Test: A Step-by-Step Guide
Selecting a Webpage Analyzer
A variety of webpage analyzers are available, each with unique features. Popular and reliable options include:
- Dareboost: Offers in-depth reports with clear, actionable recommendations.
- Google PageSpeed Insights: Provides performance scores and suggestions for both mobile and desktop.
- GTmetrix: A comprehensive tool for detailed analysis, offering performance reports and historical tracking.
Choose a tool that aligns with your specific needs and provides the insights required to improve your site. For example, Dareboost delivers reports that clearly outline performance scores, identify issues, and highlight successes.
Inputting Your Website URL
Once you've chosen a tool, simply enter your website's full address (URL) into the provided field. The analyzer will then scan your site and generate a performance report.
To ensure the most accurate test, use the exact URL that visitors see, including the 'www' prefix if your site uses it.
Analyzing the Results
After the scan, you will receive a detailed report. Review it carefully, focusing on the key metrics (LCP, TBT, CLS) and the specific recommendations. Identify both your strengths and the areas needing improvement.
Pay special attention to sections labeled 'Opportunities' or 'Items to Fix.' These provide direct, actionable steps you or your developer can take to accelerate your site.
Below is an example structure of a typical performance analysis report:
Dareboost - Pros
and Cons
Pros
Comprehensive analysis: Dareboost delivers in-depth insights into speed, SEO, and accessibility.
Actionable advice: The tool provides clear, practical recommendations for improvement.
User-friendly interface: The dashboard is intuitive and easy to navigate for users of all levels.
Performance monitoring: It allows you to track your site's performance over time to gauge progress.
Cons
Cost: Subscription plans may be expensive for small businesses or individual site owners.
Information overload: The detailed reports can be overwhelming for beginners.
Limited free tier: The features available in the free plan are restricted.
FAQ
How often should I test my website speed?
Test your website speed regularly—at least once a month—and whenever you make significant updates. This proactive approach helps you catch performance issues early and maintain an optimal experience.
What is a good website speed score?
A good score varies by tool, but generally, aim for a score above 80-90 on Google PageSpeed Insights or a full load time under 3 seconds on tools like GTmetrix.
What are some common causes of slow website speed?
Common culprits include:Unoptimized, heavy images.Excessively large CSS and JavaScript files.Too many HTTP requests.Slow server response times.Not using browser caching effectively.
Related Questions
How can I optimize images for faster loading times?
Optimize images by:Compressing them: Use tools like TinyPNG, ShortPixel, or ImageOptim to reduce file size while preserving quality.Choosing the correct format: Use JPEG for photos, PNG for graphics with transparency, and consider modern formats like WebP.Resizing them: Ensure images are no larger than the dimensions at which they'll be displayed on the page.Implementing lazy loading: Delay loading off-screen images until a user scrolls near them.These practices drastically improve load times and user experience, and also help prevent layout shifts (CLS).
What are the benefits of using a Content Delivery Network (CDN)?
A Content Delivery Network (CDN) provides several key benefits:Faster global delivery: By serving content from servers near your users, a CDN significantly reduces load times worldwide.Enhanced reliability: CDNs provide redundancy, keeping your site online even if one server has an issue.Reduced origin server load: Offloading traffic to the CDN improves the stability and responsiveness of your main server.SEO advantage: Faster loading times contribute positively to search engine rankings.Using a CDN is a highly effective strategy for improving speed and user satisfaction across the globe.
How can I minify CSS and JavaScript files?
You can minify CSS and JavaScript using online tools (like minifycode.com) or build automation tools (like Webpack, Gulp). These processes remove unnecessary whitespace, comments, and line breaks, reducing file size for faster downloads. For WordPress users, plugins like Autoptimize can handle this automatically. Always test your site after minification to ensure no functionality is broken.








 U.S. Stocks Hit Historic Milestone as AI and Aerospace Giants Prepare for Trillion-Dollar Debut
Elon Musk, Sam Altman, and Dario Amodei, three titans of the technology sector, are advancing toward initial public offerings for their respective ventures. With SpaceX, OpenAI, and Anthropic—three industry behemoths nearing trillion-dollar valuation
U.S. Stocks Hit Historic Milestone as AI and Aerospace Giants Prepare for Trillion-Dollar Debut
Elon Musk, Sam Altman, and Dario Amodei, three titans of the technology sector, are advancing toward initial public offerings for their respective ventures. With SpaceX, OpenAI, and Anthropic—three industry behemoths nearing trillion-dollar valuation
 Swedish AI Startup Lovable Eyes $13.2 Billion Valuation After Major Funding Round
As AI-driven coding tools gain traction, Swedish startup Lovable has secured a major funding round. The company aims to raise $3 billion, potentially boosting its valuation to $13.2 billion—double the $6.6 billion recorded last December. Menlo Ventur
Google Tests Remy AI Agent for Gemini as Focus Shifts to User Control
According to Business Insider, Google is testing Remy, a new AI personal agent for Gemini. This tool aims to execute tasks on behalf of users, streamlining both professional workflows and daily routines.Currently, Remy is undergoing testing in an int
Swedish AI Startup Lovable Eyes $13.2 Billion Valuation After Major Funding Round
As AI-driven coding tools gain traction, Swedish startup Lovable has secured a major funding round. The company aims to raise $3 billion, potentially boosting its valuation to $13.2 billion—double the $6.6 billion recorded last December. Menlo Ventur
Google Tests Remy AI Agent for Gemini as Focus Shifts to User Control
According to Business Insider, Google is testing Remy, a new AI personal agent for Gemini. This tool aims to execute tasks on behalf of users, streamlining both professional workflows and daily routines.Currently, Remy is undergoing testing in an int

2026 Latest Best Top-rated AI SERP Analysis Tools for Search Strategy are curated by XIX.AI through rigorous real-world tests and weekly updated rankings. These powerful tools help you unlock hidden optimization opportunities, boost content performance, and gain a competitive edge in search. Discover your perfect tool to elevate your search strategy today. Explore now!
13 tools
xix.ai

2026 Latest Best Top-rated AI Anomaly Detection Tools for KPI Monitoring in SaaS and Ecommerce teams! XIX.AI has curated a powerful, game-changing collection based on rigorous real-world tests and weekly updated rankings. You’ll find detailed free vs paid comparison insights to help you identify the must-try solution that boosts productivity and unlocks your AI edge. Explore now!
10 tools
xix.ai

2026 Latest Best Top-Rated AI Outline Generators for Long-Form SEO Articles, meticulously curated by XIX.AI. These powerful tools offer game-changing assistance in creating high-quality content quickly, boosting writing efficiency significantly. Get a free vs paid comparison along with real-world tests and detailed rankings to help you find the must-try option that suits your needs. Explore now to unlock your AI edge.
8 tools
xix.ai

2026 Latest Best AI Study Tools for Homework and Exam Prep! XIX.AI curates a top-rated list of powerful, game-changing tools that help students boost productivity, streamline homework completion, and ace exams through real-world tests. Get a free vs paid comparison, detailed rankings, and must-try options to unlock your AI edge. Explore now!
10 tools
xix.ai

2026 Latest Best AI Vocal Demo Tools for Songwriters, Hook Creators, and Multi-Language Content Teams! XIX.AI has curated a top-rated list of powerful game-changing tools that go through rigorous real-world tests. You’ll find detailed free vs paid comparison data, comprehensive rankings, and must-try options to help you boost writing efficiency and unlock your creative potential. Explore now to discover your perfect tool for all your content needs!
9 tools
xix.ai

2026 Latest Best Top-rated AI Competitive Research Tools for Small Businesses! XIX.AI has curated a highly powerful game-changing collection, updated weekly with rigorous real-world tests and detailed rankings. You can find a comprehensive free vs paid comparison to help you identify the must-try tools that boost your productivity and give you a competitive edge. Explore now to discover your perfect tool!
9 tools
xix.ai

Just realized my site speed test results are basically a horror movie in graph form 🎬📉 Tempted to just throw more servers at it, but optimization tips here seem more sustainable. Anyone else find the Core Web Vitals changes in 2025 confusing?
Je ne savais pas que la vitesse du site web avait un tel impact sur le taux de rebond 😮 C'est un peu effrayant de penser que quelques secondes de retard peuvent coûter des clients. Est-ce que les outils de test mentionnés sont adaptés aux petits sites e-commerce ?