Home
HomeHow to graph two-variable inequalities in 2025? A complete step-by-step guide.
Mastering the art of graphing two-variable inequalities is a fundamental skill in algebra and essential for pre-calculus. This detailed guide offers a clear, step-by-step method to understand and solve these problems, focusing on practical techniques and real-world relevance. Whether you're a student aiming to boost your understanding or an educator seeking effective instructional strategies, this resource provides the tools you need to graph inequalities with confidence.
Key Points
Grasp the foundational concepts of graphing two-variable inequalities.
Learn to select test points to identify the correct shaded region.
Practice writing inequalities based on their corresponding graphs.
Distinguish between solid and dashed lines and what each indicates about the inequality.
Connect proportional relationships across tables, graphs, and equations.
Graphing Two-Variable Inequalities: A Step-by-Step Approach
Understanding the Basics
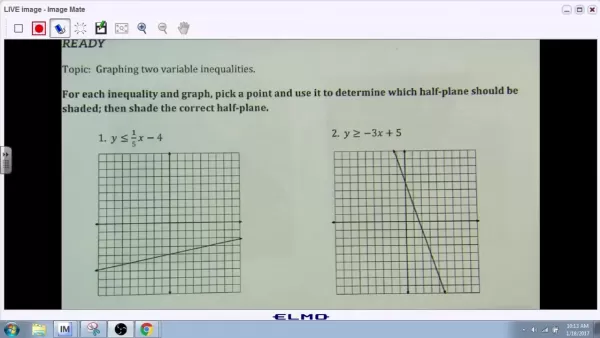
Graphing a two-variable inequality means visually representing its solutions on a coordinate plane. Unlike equations, which have specific solution points, inequalities have a continuous set of solutions shown as a shaded area. A boundary line splits the plane into two half-planes, and shading the correct one shows all possible solutions.
This skill is vital in fields like economics, engineering, and computer science, where modeling constraints and optimizing solutions is key.
Key Concepts:
- Boundary Line: The line dividing the solution region from the non-solution region. It is graphed as if it were an equation.
- Half-Plane: The area on one side of the boundary line. One of these half-planes contains all solutions to the inequality.
- Shading: Marking the correct half-plane to visually represent the set of solutions.
- Solid vs. Dashed Line: A solid line means points on the line are included in the solution set (≤ or ≥). A dashed line means they are not included (> or <).
SEO Keywords: graphing inequalities, two-variable inequalities, coordinate plane, shading region, boundary line, solution set
Step 1: Choosing a Point to Determine Shading
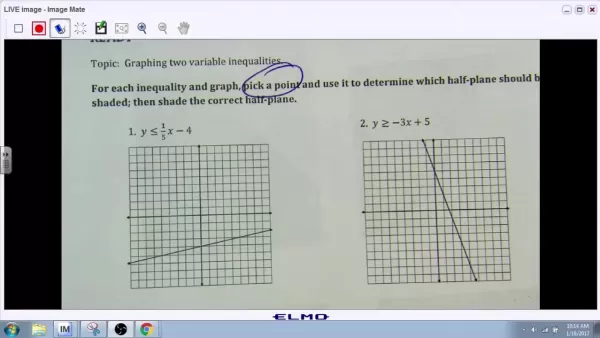
After graphing the boundary line, the next step is to decide which side to shade. This is done by picking a test point that is not on the line. The origin (0,0) is often a convenient choice, unless the line passes through it. If the test point satisfies the inequality, shade the half-plane containing that point. If it does not, shade the opposite side.
Example:
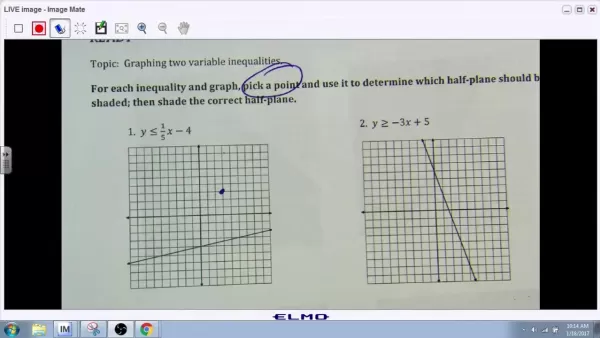
Consider the inequality y ≤ 1/5x - 4. To determine the shading, we test a point like (3,3). Substitute the values: 3 ≤ (1/5)(3) - 4. This simplifies to 3 ≤ 3/5 - 4, or 3 ≤ -17/5. Since this is false, we shade the half-plane opposite the point (3,3). This method reliably identifies the solution set.
SEO Keywords: test point, shading inequalities, half-plane, solution set, determining shading, graphing techniques
Step 2: Understanding Inequality Signs and Line Types
The type of boundary line (solid or dashed) depends directly on the inequality symbol. Use a solid line for inequalities that include equality (≤ or ≥), indicating points on the line are solutions. Use a dashed line for strict inequalities (> or <), meaning points on the line are not solutions. This distinction is crucial for an accurate graph.
Example:
- y ≥ -3x + 5: This uses a solid line because solutions include points where y equals -3x+5.
- y < 2x - 1: This uses a dashed line because solutions do not include points where y equals 2x-1.
Correctly applying these rules ensures your graph perfectly matches the given inequality.
These fundamentals are essential for all subsequent graphing work.
SEO Keywords: solid line, dashed line, inequality sign, graphing rules, boundary line, solution set
Step 3: Creating Inequalities from Graphs
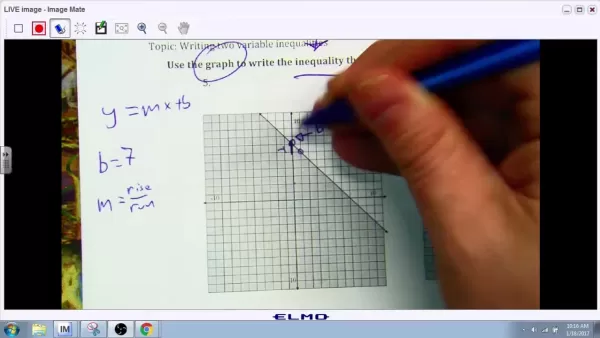
You may also need to work backwards: writing an inequality from a given graph. This involves finding the equation of the boundary line in slope-intercept form (y = mx + b) and then determining the correct inequality symbol. The line's slope (m) and y-intercept (b) can be read directly from the graph.
Finding the Slope and Y-Intercept:
- Y-Intercept (b): The point where the line crosses the y-axis.
- Slope (m): Calculated as rise over run—the vertical change per unit of horizontal change.
For example, if a line crosses the y-axis at 7 and has a downward slope, its slope is negative. By picking two clear points, you can calculate the exact slope.
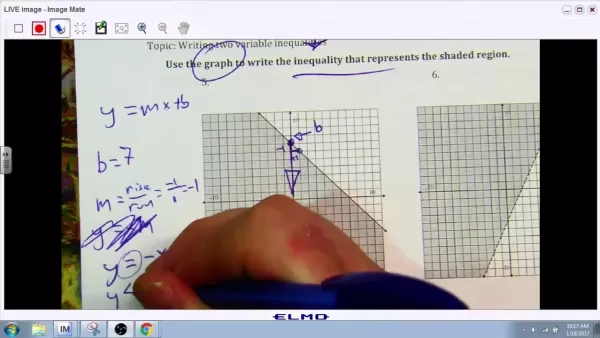
Once you have 'm' and 'b', you write the linear expression. The direction of the shading (above or below the line) tells you whether to use >, <, ≥, or ≤.
SEO Keywords: slope-intercept form, y-intercept, rise over run, creating inequalities, graphing backwards
Connecting Representations: Table, Graph, and Equation
Proportional Relationships
Understanding proportional relationships is key to linking tables, graphs, and equations. A proportional relationship means the two variables change at a constant rate, resulting in a straight-line graph that passes through the origin (0,0).
Table:
A table shows pairs of values with a constant ratio. For instance:
Days Cost 1 | 8
2 | 16
3 | 24
4 | 32
Graph:
Plotting these points creates a straight line through the origin. The line's slope represents the constant of proportionality.
Equation:
The equation for a proportional relationship is y = kx, where k is the constant. Here, k=8, so the equation is y = 8x.
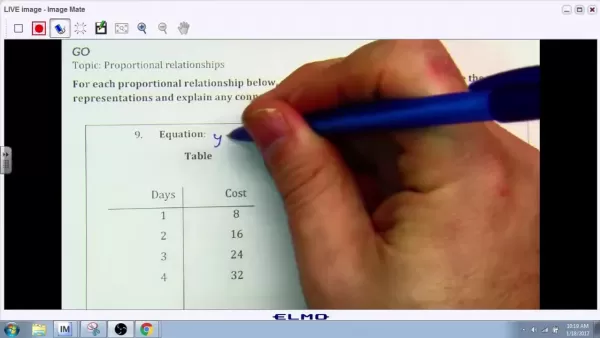
The equation concisely captures the relationship shown in the table and the graph.
Real-world Context:
For example, if Victor spends money on burritos each day, the total cost (y) is proportional to the number of days (x), with each day costing $8. This illustrates how proportional relationships model real-world scenarios.
SEO Keywords: proportional relationships, table, graph, equation, constant of proportionality, real-world context
How to Graph Inequalities Using This Knowledge
Putting It All Together to Solve and Check Your Work
Here is a systematic approach to graphing and verifying your work:
- Start with the Inequality: You are given the inequality and its corresponding graph, which saves initial plotting time.
- Choose a Convenient Test Point: Select a point not on the line, such as (3,3), to simplify determining the shading region.
- Substitute into the Inequality: Plug the x and y coordinates of your test point into the inequality.
- Interpret the Result:
- TRUE: The point satisfies the inequality. Shade the half-plane containing this point.
- FALSE: The point does not satisfy the inequality. Shade the opposite half-plane.
- Apply Correct Shading: Based on your test result, shade the appropriate side of the boundary line.
Example:
In the video example, y ≤ (1/5)x - 4, testing (3,3) gave a false result, confirming the shading should be on the side opposite (3,3).
SEO Keywords: graphing inequalities, two-variable inequalities, coordinate plane, solution set, shading region.
Pros and Cons of Graphing Inequalities
Pros
Offers a powerful visual representation of an inequality's solution set.
Enhances comprehension of the continuous range of possible solutions.
Invaluable for solving optimization problems in economics, engineering, and data science.
Aids in problem-solving by providing a clear visual model for calculations.
Cons
Can be time-intensive for intricate inequalities or systems.
Demands precision to avoid errors in line type or shading direction.
Limited to two variables for clear visualization on a standard coordinate plane.
Frequently Asked Questions
What happens if the test point lies on the boundary line?
If your chosen test point lies directly on the boundary line, it will not help you determine which side to shade. The test point must be selected from a region clearly on one side of the line, allowing you to test whether that entire region satisfies the inequality.
How do I choose an appropriate scale for my graph?
Select a scale based on the range of values in your inequality. For typical classroom problems, scales of 1 or 10 units per grid line are common. If dealing with very large numbers, use a larger increment (e.g., 100s). For very small or precise values, a finer scale using decimals or fractions may be necessary to ensure accuracy.
Related Questions
How do I graph systems of inequalities?
To graph a system of inequalities, graph each inequality on the same coordinate plane. The solution to the system is the region where the shaded areas of all inequalities overlap. This intersection represents the set of points that satisfy every condition in the system simultaneously and is commonly used in linear programming and multi-constraint modeling.
Related article
 How to fix Core Web Vitals for better SEO rankings
Streamline Report Card Comments with AI ToolsIntroductionAI Tools for Generating Report Card CommentsMagic SchoolAlmanac AIChat GPTUsing Magic School to Generate Report Card CommentsLogging into Magic SchoolSelecting the Report Card Comments ToolCust
Slackbot Becomes an AI Agent
Slackbot, the automated assistant embedded in Salesforce’s corporate messaging platform Slack, is evolving into an AI agent. Salesforce CTO Parker Harris envisions it achieving viral status comparable to OpenAI’s ChatGPT.The cloud software giant laun
ByteDance Boosts Core AI Incentives as Doubao Surges 14.6%
ByteDance recently convened a DouBao equity briefing to unveil fresh incentive policies for staff involved in the DouBao division. The strike price for DouBao shares has been lifted from $14.85 in June 2026 to $17.02, marking an approximate 14.6% inc
Related Special Topic Recommendations
Education and Learning
How to fix Core Web Vitals for better SEO rankings
Streamline Report Card Comments with AI ToolsIntroductionAI Tools for Generating Report Card CommentsMagic SchoolAlmanac AIChat GPTUsing Magic School to Generate Report Card CommentsLogging into Magic SchoolSelecting the Report Card Comments ToolCust
Slackbot Becomes an AI Agent
Slackbot, the automated assistant embedded in Salesforce’s corporate messaging platform Slack, is evolving into an AI agent. Salesforce CTO Parker Harris envisions it achieving viral status comparable to OpenAI’s ChatGPT.The cloud software giant laun
ByteDance Boosts Core AI Incentives as Doubao Surges 14.6%
ByteDance recently convened a DouBao equity briefing to unveil fresh incentive policies for staff involved in the DouBao division. The strike price for DouBao shares has been lifted from $14.85 in June 2026 to $17.02, marking an approximate 14.6% inc
Related Special Topic Recommendations
Education and Learning
 AI Study Tools for Homework and Exam Prep
2026 Latest Best AI Study Tools for Homework and Exam Prep! XIX.AI curates a top-rated list of powerful, game-changing tools that help students boost productivity, streamline homework completion, and ace exams through real-world tests. Get a free vs paid comparison, detailed rankings, and must-try options to unlock your AI edge. Explore now!
 10 tools
 xix.ai
Music composition
AI Vocal Demo Tools for Songwriters, Hooks, Toplines, and Multilingual Draft Sessions
xix.ai
Music composition
AI Vocal Demo Tools for Songwriters, Hooks, Toplines, and Multilingual Draft Sessions
2026 Latest Best AI Vocal Demo Tools for Songwriters, Hook Creators, and Multi-Language Content Teams! XIX.AI has curated a top-rated list of powerful game-changing tools that go through rigorous real-world tests. You’ll find detailed free vs paid comparison data, comprehensive rankings, and must-try options to help you boost writing efficiency and unlock your creative potential. Explore now to discover your perfect tool for all your content needs!
9 tools
xix.ai
Business
Best AI Competitive Research Tools for Small Businesses
2026 Latest Best Top-rated AI Competitive Research Tools for Small Businesses! XIX.AI has curated a highly powerful game-changing collection, updated weekly with rigorous real-world tests and detailed rankings. You can find a comprehensive free vs paid comparison to help you identify the must-try tools that boost your productivity and give you a competitive edge. Explore now to discover your perfect tool!
9 tools
xix.ai
Image editing
Photoshop AI Retouch Tools for Ecommerce Apparel, Skin Cleanup, and Color Consistency
2026 Latest Best Photoshop AI retouch tools for ecommerce apparel, skin cleanup, and color consistency! This top-rated curated list features powerful game-changing solutions that help you boost writing efficiency, streamline content creation, and achieve perfect visual results effortlessly. Each tool has undergone real-world tests through weekly updated rankings, complete with free vs paid comparison details. Backed by XIX.AI, it’s the must-try guide for anyone aiming to unlock your AI edge. Explore now!
10 tools
xix.ai
Prompt
Best AI Prompt Libraries for ChatGPT Workflows
2026 Latest Best Top-Rated AI Prompt Libraries for optimizing all types of ChatGPT workflows. XIX.AI has curated a powerful, game-changing collection that goes through rigorous real-world tests to ensure top performance. You can find detailed free vs paid comparisons and expert rankings to help you choose the must-try tools that boost your productivity and unlock your AI edge. Explore now!
11 tools
xix.ai
Education and Learning
AI Quiz Builder Platforms for Teachers, Tutors, and Cohort-Based Learning Programs
2026 Latest Best AI Quiz Builder Platforms for Teachers, Tutors, and Cohort-Based Learning Programs! XIX.AI has curated a top-rated list of powerful game-changing tools that go through real-world tests to deliver accurate rankings. These must-try platforms help boost writing efficiency, streamline content creation, and simplify quiz design across all learning scenarios. Explore now to discover your perfect tool for unlocking your AI edge in teaching!
13 tools
xix.ai

 Comments (2)
0/500
Comments (2)
0/500
![JuanWhite]()
Finally, a guide that doesn't just throw formulas at you! The step-by-step breakdown for shading the solution region was super clear. I always got confused about whether to use a dashed or solid line, but the 'test point' trick explained here makes it foolproof. Definitely bookmarking this for my algebra review next semester. 📈
![RaymondBaker]()
Endlich mal eine Anleitung, die wirklich Schritt für Schritt erklärt! Ich hatte in der Schule immer Probleme mit Ungleichungen, aber die praktischen Tipps hier sind echt hilfreich. Besonders die Visualisierungstechniken – hätte ich die damals gekannt, wäre Mathe vielleicht weniger frustrierend gewesen 😅. Ob solche Guides in Zukunft vielleicht durch KI personalisiert werden könnten? Das wäre der Hammer!
Mastering the art of graphing two-variable inequalities is a fundamental skill in algebra and essential for pre-calculus. This detailed guide offers a clear, step-by-step method to understand and solve these problems, focusing on practical techniques and real-world relevance. Whether you're a student aiming to boost your understanding or an educator seeking effective instructional strategies, this resource provides the tools you need to graph inequalities with confidence.
Key Points
Grasp the foundational concepts of graphing two-variable inequalities.
Learn to select test points to identify the correct shaded region.
Practice writing inequalities based on their corresponding graphs.
Distinguish between solid and dashed lines and what each indicates about the inequality.
Connect proportional relationships across tables, graphs, and equations.
Graphing Two-Variable Inequalities: A Step-by-Step Approach
Understanding the Basics
Graphing a two-variable inequality means visually representing its solutions on a coordinate plane. Unlike equations, which have specific solution points, inequalities have a continuous set of solutions shown as a shaded area. A boundary line splits the plane into two half-planes, and shading the correct one shows all possible solutions.
This skill is vital in fields like economics, engineering, and computer science, where modeling constraints and optimizing solutions is key.
Key Concepts:
- Boundary Line: The line dividing the solution region from the non-solution region. It is graphed as if it were an equation.
- Half-Plane: The area on one side of the boundary line. One of these half-planes contains all solutions to the inequality.
- Shading: Marking the correct half-plane to visually represent the set of solutions.
- Solid vs. Dashed Line: A solid line means points on the line are included in the solution set (≤ or ≥). A dashed line means they are not included (> or <).
SEO Keywords: graphing inequalities, two-variable inequalities, coordinate plane, shading region, boundary line, solution set
Step 1: Choosing a Point to Determine Shading
After graphing the boundary line, the next step is to decide which side to shade. This is done by picking a test point that is not on the line. The origin (0,0) is often a convenient choice, unless the line passes through it. If the test point satisfies the inequality, shade the half-plane containing that point. If it does not, shade the opposite side.
Example:
Consider the inequality y ≤ 1/5x - 4. To determine the shading, we test a point like (3,3). Substitute the values: 3 ≤ (1/5)(3) - 4. This simplifies to 3 ≤ 3/5 - 4, or 3 ≤ -17/5. Since this is false, we shade the half-plane opposite the point (3,3). This method reliably identifies the solution set.
SEO Keywords: test point, shading inequalities, half-plane, solution set, determining shading, graphing techniques
Step 2: Understanding Inequality Signs and Line Types
The type of boundary line (solid or dashed) depends directly on the inequality symbol. Use a solid line for inequalities that include equality (≤ or ≥), indicating points on the line are solutions. Use a dashed line for strict inequalities (> or <), meaning points on the line are not solutions. This distinction is crucial for an accurate graph.
Example:
- y ≥ -3x + 5: This uses a solid line because solutions include points where y equals -3x+5.
- y < 2x - 1: This uses a dashed line because solutions do not include points where y equals 2x-1.
Correctly applying these rules ensures your graph perfectly matches the given inequality.
These fundamentals are essential for all subsequent graphing work.
SEO Keywords: solid line, dashed line, inequality sign, graphing rules, boundary line, solution set
Step 3: Creating Inequalities from Graphs
You may also need to work backwards: writing an inequality from a given graph. This involves finding the equation of the boundary line in slope-intercept form (y = mx + b) and then determining the correct inequality symbol. The line's slope (m) and y-intercept (b) can be read directly from the graph.
Finding the Slope and Y-Intercept:
- Y-Intercept (b): The point where the line crosses the y-axis.
- Slope (m): Calculated as rise over run—the vertical change per unit of horizontal change.
For example, if a line crosses the y-axis at 7 and has a downward slope, its slope is negative. By picking two clear points, you can calculate the exact slope.
Once you have 'm' and 'b', you write the linear expression. The direction of the shading (above or below the line) tells you whether to use >, <, ≥, or ≤.
SEO Keywords: slope-intercept form, y-intercept, rise over run, creating inequalities, graphing backwards
Connecting Representations: Table, Graph, and Equation
Proportional Relationships
Understanding proportional relationships is key to linking tables, graphs, and equations. A proportional relationship means the two variables change at a constant rate, resulting in a straight-line graph that passes through the origin (0,0).
Table:
A table shows pairs of values with a constant ratio. For instance:
1 | 8
2 | 16
3 | 24
4 | 32
Graph:
Plotting these points creates a straight line through the origin. The line's slope represents the constant of proportionality.
Equation:
The equation for a proportional relationship is y = kx, where k is the constant. Here, k=8, so the equation is y = 8x.
The equation concisely captures the relationship shown in the table and the graph.
Real-world Context:
For example, if Victor spends money on burritos each day, the total cost (y) is proportional to the number of days (x), with each day costing $8. This illustrates how proportional relationships model real-world scenarios.
SEO Keywords: proportional relationships, table, graph, equation, constant of proportionality, real-world context
How to Graph Inequalities Using This Knowledge
Putting It All Together to Solve and Check Your Work
Here is a systematic approach to graphing and verifying your work:
- Start with the Inequality: You are given the inequality and its corresponding graph, which saves initial plotting time.
- Choose a Convenient Test Point: Select a point not on the line, such as (3,3), to simplify determining the shading region.
- Substitute into the Inequality: Plug the x and y coordinates of your test point into the inequality.
- Interpret the Result:
- TRUE: The point satisfies the inequality. Shade the half-plane containing this point.
- FALSE: The point does not satisfy the inequality. Shade the opposite half-plane.
- Apply Correct Shading: Based on your test result, shade the appropriate side of the boundary line.
Example:
In the video example, y ≤ (1/5)x - 4, testing (3,3) gave a false result, confirming the shading should be on the side opposite (3,3).
SEO Keywords: graphing inequalities, two-variable inequalities, coordinate plane, solution set, shading region.
Pros and Cons of Graphing Inequalities
Pros
Offers a powerful visual representation of an inequality's solution set.
Enhances comprehension of the continuous range of possible solutions.
Invaluable for solving optimization problems in economics, engineering, and data science.
Aids in problem-solving by providing a clear visual model for calculations.
Cons
Can be time-intensive for intricate inequalities or systems.
Demands precision to avoid errors in line type or shading direction.
Limited to two variables for clear visualization on a standard coordinate plane.
Frequently Asked Questions
What happens if the test point lies on the boundary line?
If your chosen test point lies directly on the boundary line, it will not help you determine which side to shade. The test point must be selected from a region clearly on one side of the line, allowing you to test whether that entire region satisfies the inequality.
How do I choose an appropriate scale for my graph?
Select a scale based on the range of values in your inequality. For typical classroom problems, scales of 1 or 10 units per grid line are common. If dealing with very large numbers, use a larger increment (e.g., 100s). For very small or precise values, a finer scale using decimals or fractions may be necessary to ensure accuracy.
Related Questions
How do I graph systems of inequalities?
To graph a system of inequalities, graph each inequality on the same coordinate plane. The solution to the system is the region where the shaded areas of all inequalities overlap. This intersection represents the set of points that satisfy every condition in the system simultaneously and is commonly used in linear programming and multi-constraint modeling.








 How to fix Core Web Vitals for better SEO rankings
Streamline Report Card Comments with AI ToolsIntroductionAI Tools for Generating Report Card CommentsMagic SchoolAlmanac AIChat GPTUsing Magic School to Generate Report Card CommentsLogging into Magic SchoolSelecting the Report Card Comments ToolCust
How to fix Core Web Vitals for better SEO rankings
Streamline Report Card Comments with AI ToolsIntroductionAI Tools for Generating Report Card CommentsMagic SchoolAlmanac AIChat GPTUsing Magic School to Generate Report Card CommentsLogging into Magic SchoolSelecting the Report Card Comments ToolCust
 Slackbot Becomes an AI Agent
Slackbot, the automated assistant embedded in Salesforce’s corporate messaging platform Slack, is evolving into an AI agent. Salesforce CTO Parker Harris envisions it achieving viral status comparable to OpenAI’s ChatGPT.The cloud software giant laun
Slackbot Becomes an AI Agent
Slackbot, the automated assistant embedded in Salesforce’s corporate messaging platform Slack, is evolving into an AI agent. Salesforce CTO Parker Harris envisions it achieving viral status comparable to OpenAI’s ChatGPT.The cloud software giant laun
 ByteDance Boosts Core AI Incentives as Doubao Surges 14.6%
ByteDance recently convened a DouBao equity briefing to unveil fresh incentive policies for staff involved in the DouBao division. The strike price for DouBao shares has been lifted from $14.85 in June 2026 to $17.02, marking an approximate 14.6% inc
ByteDance Boosts Core AI Incentives as Doubao Surges 14.6%
ByteDance recently convened a DouBao equity briefing to unveil fresh incentive policies for staff involved in the DouBao division. The strike price for DouBao shares has been lifted from $14.85 in June 2026 to $17.02, marking an approximate 14.6% inc

2026 Latest Best AI Study Tools for Homework and Exam Prep! XIX.AI curates a top-rated list of powerful, game-changing tools that help students boost productivity, streamline homework completion, and ace exams through real-world tests. Get a free vs paid comparison, detailed rankings, and must-try options to unlock your AI edge. Explore now!
10 tools
xix.ai

2026 Latest Best AI Vocal Demo Tools for Songwriters, Hook Creators, and Multi-Language Content Teams! XIX.AI has curated a top-rated list of powerful game-changing tools that go through rigorous real-world tests. You’ll find detailed free vs paid comparison data, comprehensive rankings, and must-try options to help you boost writing efficiency and unlock your creative potential. Explore now to discover your perfect tool for all your content needs!
9 tools
xix.ai

2026 Latest Best Top-rated AI Competitive Research Tools for Small Businesses! XIX.AI has curated a highly powerful game-changing collection, updated weekly with rigorous real-world tests and detailed rankings. You can find a comprehensive free vs paid comparison to help you identify the must-try tools that boost your productivity and give you a competitive edge. Explore now to discover your perfect tool!
9 tools
xix.ai

2026 Latest Best Photoshop AI retouch tools for ecommerce apparel, skin cleanup, and color consistency! This top-rated curated list features powerful game-changing solutions that help you boost writing efficiency, streamline content creation, and achieve perfect visual results effortlessly. Each tool has undergone real-world tests through weekly updated rankings, complete with free vs paid comparison details. Backed by XIX.AI, it’s the must-try guide for anyone aiming to unlock your AI edge. Explore now!
10 tools
xix.ai

2026 Latest Best Top-Rated AI Prompt Libraries for optimizing all types of ChatGPT workflows. XIX.AI has curated a powerful, game-changing collection that goes through rigorous real-world tests to ensure top performance. You can find detailed free vs paid comparisons and expert rankings to help you choose the must-try tools that boost your productivity and unlock your AI edge. Explore now!
11 tools
xix.ai

2026 Latest Best AI Quiz Builder Platforms for Teachers, Tutors, and Cohort-Based Learning Programs! XIX.AI has curated a top-rated list of powerful game-changing tools that go through real-world tests to deliver accurate rankings. These must-try platforms help boost writing efficiency, streamline content creation, and simplify quiz design across all learning scenarios. Explore now to discover your perfect tool for unlocking your AI edge in teaching!
13 tools
xix.ai

Finally, a guide that doesn't just throw formulas at you! The step-by-step breakdown for shading the solution region was super clear. I always got confused about whether to use a dashed or solid line, but the 'test point' trick explained here makes it foolproof. Definitely bookmarking this for my algebra review next semester. 📈
Endlich mal eine Anleitung, die wirklich Schritt für Schritt erklärt! Ich hatte in der Schule immer Probleme mit Ungleichungen, aber die praktischen Tipps hier sind echt hilfreich. Besonders die Visualisierungstechniken – hätte ich die damals gekannt, wäre Mathe vielleicht weniger frustrierend gewesen 😅. Ob solche Guides in Zukunft vielleicht durch KI personalisiert werden könnten? Das wäre der Hammer!