Home
HomeAI-Powered Excel Pivot Tables Streamline Complex Data Analysis
This guide demonstrates how integrating Excel's pivot tables with AI can transform your data analysis workflow. While pivot tables excel at summarizing complex datasets, they have inherent limitations. We provide actionable strategies for handling large datasets efficiently while avoiding common character limit constraints. Discover how AI-powered solutions can complement Excel's functionality to unlock deeper insights.
Key Points
Pivot tables remain indispensable for Excel-powered data aggregation and reporting.
Excel's character constraints can disrupt complex analytical operations.
Strategic use of DAX functions helps circumvent text length barriers.
AI integration elevates data insights beyond conventional spreadsheet capabilities.
Understanding the Power and Limitations of Excel Pivot Tables
What are Pivot Tables and Why Use Them?
Pivot tables represent Excel's most dynamic analytical tool, enabling rapid transformation of raw data into structured reports.

These interactive dashboards allow users to rearrange, filter, and summarize data fields without altering source information. Their true power lies in revealing hidden trends and patterns within complex datasets, making them essential for data-driven decision making across industries.
Common analytical applications include:
- Regional sales performance analysis by product category
- Marketing campaign ROI comparisons
- Demographic-based customer satisfaction metrics
Key advantages cement pivot tables' role in business analytics:
- Instant summarization of million-row datasets
- Visual pattern recognition through dynamic filtering
- Customizable reporting frameworks
- Non-destructive data exploration
- Reduced manual calculation errors
- Accessible analytical capabilities
The Character Limit Challenge in Excel
Despite their versatility, Excel's technical thresholds emerge when processing enterprise-scale datasets or sophisticated formulas. The 32,767-character cell limit frequently disrupts operations involving:
- Multi-field text concatenation
- Complex nested logical statements
- Advanced DAX measure development
These constraints manifest through cryptic error messages when pivot operations exceed system capacities. Strategic approaches become necessary to maintain analytical continuity.
Solutions for Overcoming Excel's Limitations
Leveraging DAX Functions to Bypass Character Limits
The CONCATENATEX DAX function provides an elegant solution to Excel's text constraints.
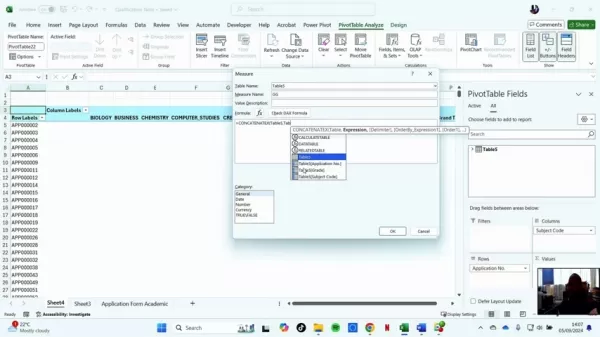
Implementing this advanced function requires activating Power Pivot through Excel's Data tab. The integration unlocks:
- Enterprise-scale text aggregation
- Cross-table reference capabilities
- Formula complexity exceeding standard Excel limits
Combining Excel with AI for Enhanced Data Analysis
Modern analytics increasingly leverage AI integrations to augment Excel's native capabilities:
- Predictive modeling via Azure ML connectors
- Automated anomaly detection through AI plugins
- Natural language processing for formula generation
- Python scripting for advanced statistical analysis
Step-by-Step Guide to Creating a DAX Measure in Power Pivot
Open and Manage Power Pivot
Navigate to Power Pivot via Excel's Data ribbon.
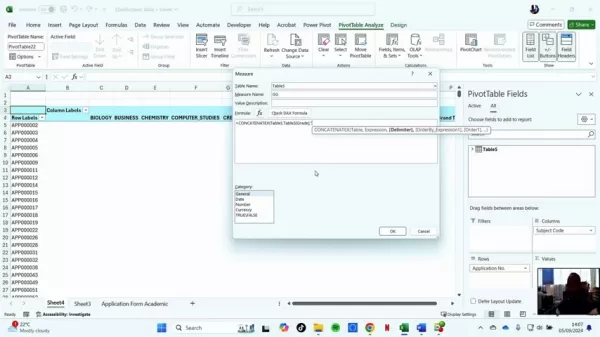
Create a Measure
Access the calculation grid to input specialized DAX formulas.
Use CONCATENATEX to build your formula
Construct your aggregation logic within the DAX formula builder.

Pros and Cons of Using Excel Pivot Tables
Pros
Intuitive user interface
Rapid data summarization
Customizable reporting structures
Cons
Formula complexity limitations
Text aggregation constraints
Performance degradation with oversized datasets
FAQ
Why are pivot tables useful?
Pivot tables enable dynamic data interrogation without programming expertise, transforming raw information into actionable business intelligence through intuitive drag-and-drop functionality.
What is CONCATENATEX?
This advanced DAX function facilitates enterprise-scale text combination operations, overcoming Excel's inherent character constraints through Power Pivot integration.
How can AI be used in Excel for data analysis?
AI expands Excel's analytical horizons through predictive modeling, natural language processing, and automated pattern recognition - transforming spreadsheets into intelligent decision support systems.
Related Questions
What other DAX functions are useful for data analysis in Power Pivot?
Advanced DAX functions like CALCULATE, SUMX, and FILTER enable sophisticated context-aware calculations, iterative computations, and dynamic dataset filtering respectively.
What are the alternatives to pivot tables?
Modern BI platforms like Power BI and Tableau offer enhanced visualization and modeling capabilities, while programming languages like Python provide unlimited analytical flexibility.
Related article
 How Fintech Companies Achieve Strong Return on Investment by Leveraging Data
A solid foundation of integrated data is essential for boosting return on investment in fintech marketing efforts. Credit: Getty ImagesStephen Williams, CEO of Marketing Evolution, explains why unified data represents a crucial missing element for fi
Bain forecasts US$100 billion SaaS market in agentic AI automation
Bain & Company has estimated a $100 billion market in the U.S. for SaaS companies leveraging agentic AI. The firm said this market stems from automating coordination tasks within enterprise systems.This estimate comes from the second installment in B
Kakao Mobility outlines Level 4 autonomous driving roadmap for physical AI
Kakao Mobility is planning to develop Level 4 autonomous driving technologies internally as part of its physical AI strategy.
At the 2026 World IT Show conference in Seoul's COEX, Kim Jin-kyu — vice president and head of Kakao Mobility's Physical AI
Related Special Topic Recommendations
Prompt
How Fintech Companies Achieve Strong Return on Investment by Leveraging Data
A solid foundation of integrated data is essential for boosting return on investment in fintech marketing efforts. Credit: Getty ImagesStephen Williams, CEO of Marketing Evolution, explains why unified data represents a crucial missing element for fi
Bain forecasts US$100 billion SaaS market in agentic AI automation
Bain & Company has estimated a $100 billion market in the U.S. for SaaS companies leveraging agentic AI. The firm said this market stems from automating coordination tasks within enterprise systems.This estimate comes from the second installment in B
Kakao Mobility outlines Level 4 autonomous driving roadmap for physical AI
Kakao Mobility is planning to develop Level 4 autonomous driving technologies internally as part of its physical AI strategy.
At the 2026 World IT Show conference in Seoul's COEX, Kim Jin-kyu — vice president and head of Kakao Mobility's Physical AI
Related Special Topic Recommendations
Prompt
 Best AI Prompt Libraries for ChatGPT Workflows
2026 Latest Best Top-Rated AI Prompt Libraries for optimizing all types of ChatGPT workflows. XIX.AI has curated a powerful, game-changing collection that goes through rigorous real-world tests to ensure top performance. You can find detailed free vs paid comparisons and expert rankings to help you choose the must-try tools that boost your productivity and unlock your AI edge. Explore now!
 11 tools
 xix.ai
Education and Learning
AI Quiz Builder Platforms for Teachers, Tutors, and Cohort-Based Learning Programs
xix.ai
Education and Learning
AI Quiz Builder Platforms for Teachers, Tutors, and Cohort-Based Learning Programs
2026 Latest Best AI Quiz Builder Platforms for Teachers, Tutors, and Cohort-Based Learning Programs! XIX.AI has curated a top-rated list of powerful game-changing tools that go through real-world tests to deliver accurate rankings. These must-try platforms help boost writing efficiency, streamline content creation, and simplify quiz design across all learning scenarios. Explore now to discover your perfect tool for unlocking your AI edge in teaching!
13 tools
xix.ai
code
AI Pull Request Review Tools for GitHub Teams Handling Refactors, Bugs, and Security Gaps
2026 Latest Best AI Pull Request Review Tools for GitHub Teams are here on XIX.AI! This top-rated curated list showcases powerful game-changing solutions that streamline refactoring, bug fixing, and security gap detection across all team workflows. Enjoy a free vs paid comparison along with real-world tests and detailed rankings to help you find the perfect tool that boosts productivity significantly. Explore now to unlock your AI edge!
12 tools
xix.ai
Text-to-speech
Best AI Text to Speech Tools for Natural Voiceovers
2026 Latest Best Top-rated AI Text to Speech Tools for Natural Voiceovers are here on XIX.AI! This curated list features powerful, game-changing options that deliver crystal-clear voices for every use case, backed by real-world tests and weekly updated rankings. Get a free vs paid comparison to find the must-try solution that boosts your productivity instantly. Explore now to Unlock your AI edge!
11 tools
xix.ai
Comic Creation
Manga AI Background Generators for Serialized Chapters, Covers, and Promo Art
2026 Latest Best Manga AI Background Generators Ranked Top-Rated! This curated collection showcases powerful game-changing tools perfect for creating high-quality chapter backgrounds, book covers, and promotional art. Every option has undergone rigorous real-world tests to ensure reliability. Get a free vs paid comparison along with detailed insights. Explore now to discover your perfect tool and unlock your AI edge in manga creation.
6 tools
xix.ai
Image editing
AI Object Removal Editors: Clean Up Portraits, Travel, and Product Shots
2026 Latest Best Top-rated AI Object Removal Editors for portraits travel product shots! XIX.AI curates a powerful game-changing collection regularly updated with weekly rankings. These tools offer real-world tests to help you quickly remove unwanted elements, boost content quality, and save tons of time without compromising results. Must-try for anyone aiming to unlock their AI creation edge. Explore now!
10 tools
xix.ai

 Comments (1)
0/500
Comments (1)
0/500
![TimothyAllen]()
Honestly, I've been using pivot tables for years and never thought of adding AI to the mix. This guide sounds like a game-changer for handling messy datasets. Wonder if it works with old Excel versions though? 🤔
This guide demonstrates how integrating Excel's pivot tables with AI can transform your data analysis workflow. While pivot tables excel at summarizing complex datasets, they have inherent limitations. We provide actionable strategies for handling large datasets efficiently while avoiding common character limit constraints. Discover how AI-powered solutions can complement Excel's functionality to unlock deeper insights.
Key Points
Pivot tables remain indispensable for Excel-powered data aggregation and reporting.
Excel's character constraints can disrupt complex analytical operations.
Strategic use of DAX functions helps circumvent text length barriers.
AI integration elevates data insights beyond conventional spreadsheet capabilities.
Understanding the Power and Limitations of Excel Pivot Tables
What are Pivot Tables and Why Use Them?
Pivot tables represent Excel's most dynamic analytical tool, enabling rapid transformation of raw data into structured reports.
These interactive dashboards allow users to rearrange, filter, and summarize data fields without altering source information. Their true power lies in revealing hidden trends and patterns within complex datasets, making them essential for data-driven decision making across industries.
Common analytical applications include:
- Regional sales performance analysis by product category
- Marketing campaign ROI comparisons
- Demographic-based customer satisfaction metrics
Key advantages cement pivot tables' role in business analytics:
- Instant summarization of million-row datasets
- Visual pattern recognition through dynamic filtering
- Customizable reporting frameworks
- Non-destructive data exploration
- Reduced manual calculation errors
- Accessible analytical capabilities
The Character Limit Challenge in Excel
Despite their versatility, Excel's technical thresholds emerge when processing enterprise-scale datasets or sophisticated formulas. The 32,767-character cell limit frequently disrupts operations involving:
- Multi-field text concatenation
- Complex nested logical statements
- Advanced DAX measure development
These constraints manifest through cryptic error messages when pivot operations exceed system capacities. Strategic approaches become necessary to maintain analytical continuity.
Solutions for Overcoming Excel's Limitations
Leveraging DAX Functions to Bypass Character Limits
The CONCATENATEX DAX function provides an elegant solution to Excel's text constraints.
Implementing this advanced function requires activating Power Pivot through Excel's Data tab. The integration unlocks:
- Enterprise-scale text aggregation
- Cross-table reference capabilities
- Formula complexity exceeding standard Excel limits
Combining Excel with AI for Enhanced Data Analysis
Modern analytics increasingly leverage AI integrations to augment Excel's native capabilities:
- Predictive modeling via Azure ML connectors
- Automated anomaly detection through AI plugins
- Natural language processing for formula generation
- Python scripting for advanced statistical analysis
Step-by-Step Guide to Creating a DAX Measure in Power Pivot
Open and Manage Power Pivot
Navigate to Power Pivot via Excel's Data ribbon.
Create a Measure
Access the calculation grid to input specialized DAX formulas.
Use CONCATENATEX to build your formula
Construct your aggregation logic within the DAX formula builder.
Pros and Cons of Using Excel Pivot Tables
Pros
Intuitive user interface
Rapid data summarization
Customizable reporting structures
Cons
Formula complexity limitations
Text aggregation constraints
Performance degradation with oversized datasets
FAQ
Why are pivot tables useful?
Pivot tables enable dynamic data interrogation without programming expertise, transforming raw information into actionable business intelligence through intuitive drag-and-drop functionality.
What is CONCATENATEX?
This advanced DAX function facilitates enterprise-scale text combination operations, overcoming Excel's inherent character constraints through Power Pivot integration.
How can AI be used in Excel for data analysis?
AI expands Excel's analytical horizons through predictive modeling, natural language processing, and automated pattern recognition - transforming spreadsheets into intelligent decision support systems.
Related Questions
What other DAX functions are useful for data analysis in Power Pivot?
Advanced DAX functions like CALCULATE, SUMX, and FILTER enable sophisticated context-aware calculations, iterative computations, and dynamic dataset filtering respectively.
What are the alternatives to pivot tables?
Modern BI platforms like Power BI and Tableau offer enhanced visualization and modeling capabilities, while programming languages like Python provide unlimited analytical flexibility.








 How Fintech Companies Achieve Strong Return on Investment by Leveraging Data
A solid foundation of integrated data is essential for boosting return on investment in fintech marketing efforts. Credit: Getty ImagesStephen Williams, CEO of Marketing Evolution, explains why unified data represents a crucial missing element for fi
Bain forecasts US$100 billion SaaS market in agentic AI automation
Bain & Company has estimated a $100 billion market in the U.S. for SaaS companies leveraging agentic AI. The firm said this market stems from automating coordination tasks within enterprise systems.This estimate comes from the second installment in B
Kakao Mobility outlines Level 4 autonomous driving roadmap for physical AI
Kakao Mobility is planning to develop Level 4 autonomous driving technologies internally as part of its physical AI strategy.
At the 2026 World IT Show conference in Seoul's COEX, Kim Jin-kyu — vice president and head of Kakao Mobility's Physical AI
How Fintech Companies Achieve Strong Return on Investment by Leveraging Data
A solid foundation of integrated data is essential for boosting return on investment in fintech marketing efforts. Credit: Getty ImagesStephen Williams, CEO of Marketing Evolution, explains why unified data represents a crucial missing element for fi
Bain forecasts US$100 billion SaaS market in agentic AI automation
Bain & Company has estimated a $100 billion market in the U.S. for SaaS companies leveraging agentic AI. The firm said this market stems from automating coordination tasks within enterprise systems.This estimate comes from the second installment in B
Kakao Mobility outlines Level 4 autonomous driving roadmap for physical AI
Kakao Mobility is planning to develop Level 4 autonomous driving technologies internally as part of its physical AI strategy.
At the 2026 World IT Show conference in Seoul's COEX, Kim Jin-kyu — vice president and head of Kakao Mobility's Physical AI

2026 Latest Best Top-Rated AI Prompt Libraries for optimizing all types of ChatGPT workflows. XIX.AI has curated a powerful, game-changing collection that goes through rigorous real-world tests to ensure top performance. You can find detailed free vs paid comparisons and expert rankings to help you choose the must-try tools that boost your productivity and unlock your AI edge. Explore now!
11 tools
xix.ai

2026 Latest Best AI Quiz Builder Platforms for Teachers, Tutors, and Cohort-Based Learning Programs! XIX.AI has curated a top-rated list of powerful game-changing tools that go through real-world tests to deliver accurate rankings. These must-try platforms help boost writing efficiency, streamline content creation, and simplify quiz design across all learning scenarios. Explore now to discover your perfect tool for unlocking your AI edge in teaching!
13 tools
xix.ai

2026 Latest Best AI Pull Request Review Tools for GitHub Teams are here on XIX.AI! This top-rated curated list showcases powerful game-changing solutions that streamline refactoring, bug fixing, and security gap detection across all team workflows. Enjoy a free vs paid comparison along with real-world tests and detailed rankings to help you find the perfect tool that boosts productivity significantly. Explore now to unlock your AI edge!
12 tools
xix.ai

2026 Latest Best Top-rated AI Text to Speech Tools for Natural Voiceovers are here on XIX.AI! This curated list features powerful, game-changing options that deliver crystal-clear voices for every use case, backed by real-world tests and weekly updated rankings. Get a free vs paid comparison to find the must-try solution that boosts your productivity instantly. Explore now to Unlock your AI edge!
11 tools
xix.ai

2026 Latest Best Manga AI Background Generators Ranked Top-Rated! This curated collection showcases powerful game-changing tools perfect for creating high-quality chapter backgrounds, book covers, and promotional art. Every option has undergone rigorous real-world tests to ensure reliability. Get a free vs paid comparison along with detailed insights. Explore now to discover your perfect tool and unlock your AI edge in manga creation.
6 tools
xix.ai

2026 Latest Best Top-rated AI Object Removal Editors for portraits travel product shots! XIX.AI curates a powerful game-changing collection regularly updated with weekly rankings. These tools offer real-world tests to help you quickly remove unwanted elements, boost content quality, and save tons of time without compromising results. Must-try for anyone aiming to unlock their AI creation edge. Explore now!
10 tools
xix.ai

Honestly, I've been using pivot tables for years and never thought of adding AI to the mix. This guide sounds like a game-changer for handling messy datasets. Wonder if it works with old Excel versions though? 🤔