Home
HomeAI-Powered Stock Analysis: Automate Technical Analysis
Unlock the Power of AI in Stock Market Analysis
Ever wondered how you can leverage artificial intelligence to make smarter investment decisions? Dive into this comprehensive guide on using an AI-driven dashboard to automate your technical stock analysis. Whether you're a day trader or a long-term investor, you'll find actionable insights that can enhance your trading strategy. From tools and customizations to potential benefits, we've got you covered.
Key Points
- AI-powered dashboards streamline technical stock analysis.
- They run efficiently on laptops with minimal code required.
- Customize analysis to fit your specific trading strategies.
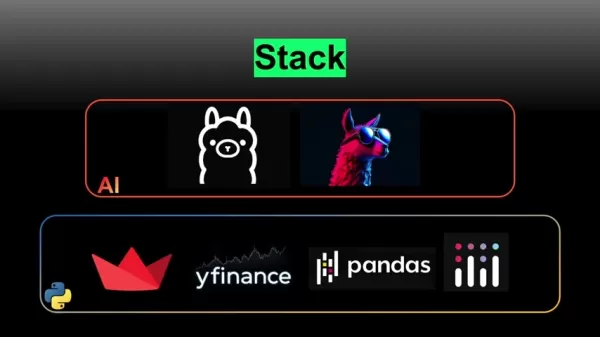
- Utilize AI tools like Ollama and Meta's Llama 3.2 vision model.
- Essential Python libraries include yfinance, Pandas, and Plotly.
Disclaimer: This tutorial is for educational purposes only. Always critically evaluate AI outputs.
Introduction to AI-Powered Stock Analysis Dashboards
What is an AI-Powered Stock Analysis Dashboard?
An AI-powered stock analysis dashboard is a game-changer for anyone involved in the stock market. It uses artificial intelligence to automate and enhance the often tedious process of technical stock analysis. Instead of manually combing through heaps of data and trying to spot patterns, an AI dashboard does the heavy lifting for you, delivering quicker and more accurate insights.
Here's what you can expect from an AI-driven dashboard:
- Data Fetching: Automatically pulls stock data from sources like yfinance.
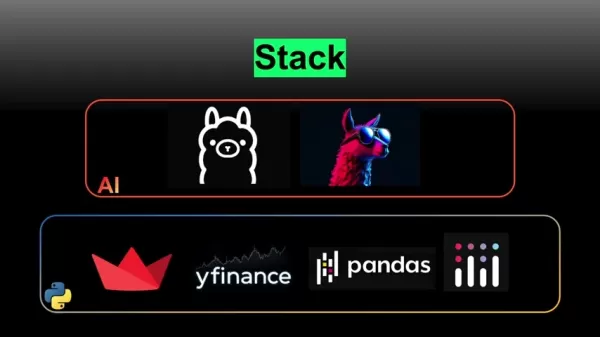
- Technical Indicators: Calculates key indicators like Simple Moving Averages (SMA), Exponential Moving Averages (EMA), Bollinger Bands, and Volume Weighted Average Price (VWAP).
- AI Vision Model: Employs AI vision models, such as Meta's Llama 3.2, to interpret chart patterns and offer informed recommendations.
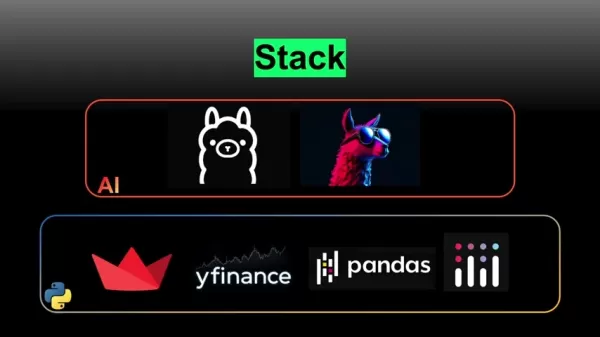
- Interactive Visualization: Uses libraries like Plotly to create interactive charts, making it easier to spot trends and patterns.
- Customization Options: Allows you to tailor analysis parameters, including stock ticker, date range, and technical indicators.
These dashboards are designed to run smoothly on standard laptops, making them accessible to both novice and seasoned traders looking to enhance their investment strategies.
Benefits of Automating Technical Stock Analysis
Automating your technical stock analysis with an AI-powered dashboard comes with a host of benefits:
- Time Savings: AI processes data much faster than humans, freeing you up to focus on strategic decisions.
- Increased Accuracy: By minimizing human error, AI provides more reliable and consistent analysis.
- Enhanced Insights: AI can pick up on subtle patterns and correlations that might slip past human analysts.
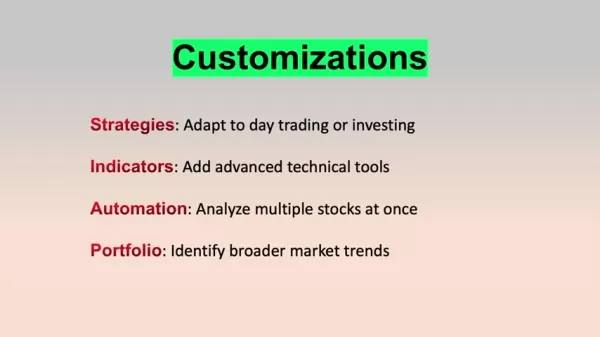
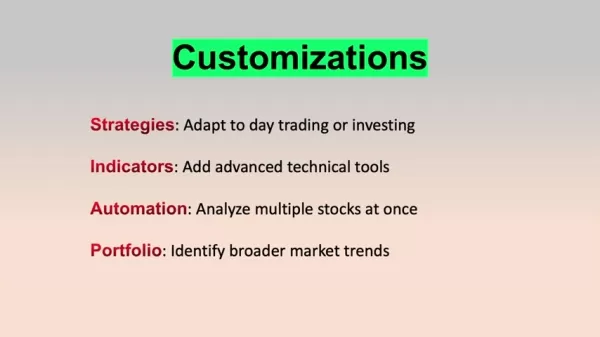
- Customizable Strategies: Tailor the analysis to align with your specific trading strategies, whether you're into day trading or long-term investing.
- Portfolio-Level Analysis: Get a comprehensive view of your investment portfolio by analyzing multiple stocks at once.
By integrating AI into your trading, you can make quicker, more informed decisions, potentially leading to better investment outcomes.
Customizing Your AI-Powered Stock Analysis Dashboard
Expanding Functionality
You can significantly enhance your AI-powered stock analysis dashboard by adding features tailored to your trading needs. Here are some ideas to get you started:
- Integrate Additional Technical Indicators: Add more indicators like the Relative Strength Index (RSI), Moving Average Convergence Divergence (MACD), and Ichimoku Cloud to deepen your analysis.
- Advanced Charting Options: Implement heatmaps or 3D charts to visualize data in new ways, helping you spot patterns more quickly.
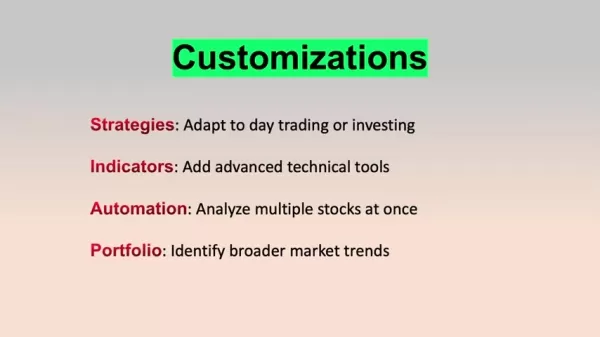
- Portfolio Level Analytics: Analyze your entire portfolio to identify broader market trends and correlations that impact your investments.
- Alert and Notification Systems: Set up automated alerts for specific technical conditions, such as crossing a moving average or reaching overbought/oversold levels.
- Backtesting Capabilities: Evaluate the performance of different trading strategies using historical data to refine and validate your approaches.
- Sentiment Analysis: Integrate tools to gauge market sentiment from news articles, social media, and other sources, giving you a more complete picture of market psychology.
- Machine Learning Models: Enhance AI capabilities with models like time series forecasting and clustering algorithms to group similar stocks or ETFs.
- Paper Trading Mode: Create a sandbox environment to practice new strategies without risking real capital, ensuring thorough testing before going live.
Step-by-Step Guide to Using the AI Stock Analysis Dashboard
Step 1: Setting Up the Environment
Before diving into the dashboard, you'll need to set up your environment. Here's how:
- Install Ollama: Head over to the Ollama website and download the installer for your operating system. Follow the instructions to set it up on your desktop.
- Run Llama 3.2 Vision Model: Open your terminal or command prompt and enter:
ollama run llama3.2-vision. This installs the Llama 3.2 vision model on your machine. Keep this window open. - Install Python Libraries: In a new terminal window, activate your Python environment and install the required libraries with:
pip install Streamlit yfinance pandas plotly ollama. 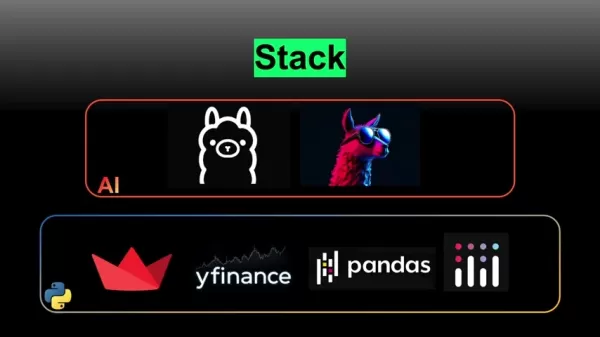
Step 2: Running the AI Technical Analysis App
With your environment set up, you're ready to run the AI technical analysis app:
- Save the Python Code: Save the provided Python code to a file named
ai_technical_analysis.py. - Run the Streamlit App: Navigate to the directory where you saved the file and run:
streamlit run path/to/folder/ai_technical_analysis.py. - Access the Dashboard: Streamlit will open your web browser to a local host address, displaying the AI Technical Stock Analysis Dashboard.
Step 3: Configuring the Dashboard
Now that the dashboard is up and running, configure it to analyze your desired stock:
- Enter Stock Ticker: In the configuration sidebar, enter the stock ticker symbol you want to analyze (e.g., AAPL, MSFT).
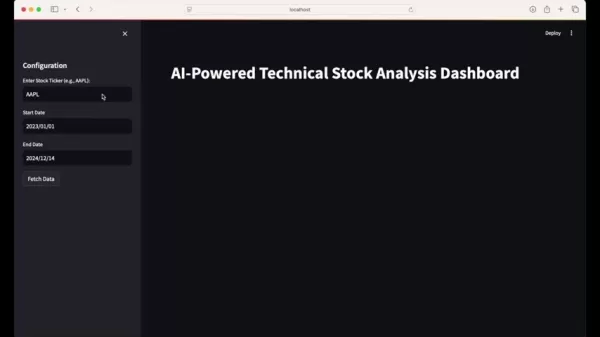
- Select Date Range: Choose the start and end dates for your analysis. The dashboard will fetch historical data within this range.
- Fetch Data: Click the "Fetch Data" button to retrieve the stock data from yfinance.
- Select Technical Indicators: Choose the technical indicators you want to overlay on the chart, such as 20-Day SMA, 20-Day EMA, Bollinger Bands, and VWAP.
Step 4: Running the AI Analysis and Interpreting Results
With your dashboard configured, you can now run the AI analysis:
- Run AI Analysis: Click the "Run AI Analysis" button to start the process. A spinner will appear, indicating that the chart is being analyzed.
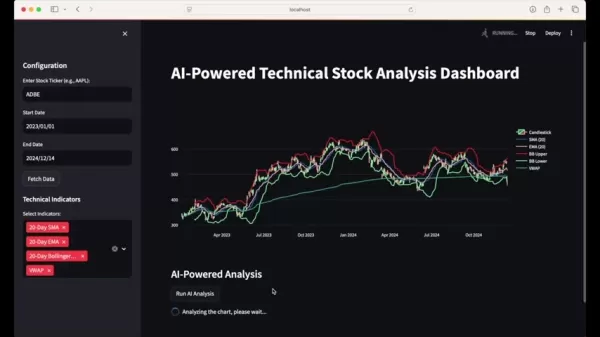
- Review AI Analysis Results: Once the analysis is complete, the AI's recommendation and reasoning will be displayed below the chart. Use these insights to inform your trading decisions.
Remember, AI outputs should be critically evaluated, as they may contain inaccuracies or misleading information.
Pros and Cons of Using an AI-Powered Stock Analysis Dashboard
Pros
- Automates complex technical analysis tasks.
- Provides quick and accurate insights.
- Offers customizable analysis parameters.
- Enhances portfolio-level analytics.
- Runs efficiently on standard laptops.
Cons
- Requires an understanding of technical analysis for effective interpretation.
- AI outputs should be critically evaluated for inaccuracies.
- May require some programming knowledge for advanced customizations.
- Heavily reliant on the availability and quality of historical data.
Core Features of the AI Stock Analysis Dashboard
Data Fetching
The dashboard uses yfinance to automatically retrieve historical stock data for specified tickers and date ranges, ensuring your analysis is always up-to-date. This integration saves you time and effort by eliminating manual data collection.
Pandas is used for efficient data manipulation and organization, allowing for easy calculation of technical indicators and data preparation for AI analysis.
Technical Indicator Integration
The dashboard integrates several technical indicators to analyze stock price movements, providing insights into market trends and potential trading opportunities. These include:
- Simple Moving Average (SMA): Averages the stock price over a specified period to identify longer-term trends.
- Exponential Moving Average (EMA): Similar to SMA but gives more weight to recent prices, making it more responsive to new information.
- Bollinger Bands: Indicates stock volatility by plotting upper and lower bands around the SMA, based on standard deviations.
- Volume Weighted Average Price (VWAP): Calculates the average price weighted by volume, showing the average price at which a stock has traded throughout the day.
AI-Powered Analysis with Llama 3.2 Vision Model
The dashboard integrates Meta's Llama 3.2 vision model to analyze stock charts. This advanced AI tool can interpret complex visual patterns and provide insights that traditional methods might miss.
The Ollama API enables seamless communication with the AI model, allowing you to customize the AI prompt to adjust analysis parameters and request specific recommendations.
Interactive Visualization with Plotly
Plotly is used to create interactive candlestick charts, providing a visual representation of stock price movements over time. These charts display the open, high, low, and close prices for each period, making it easy to identify patterns and trends.
Dynamic indicator overlays allow you to overlay technical indicators directly onto the chart, giving you a comprehensive view of stock behavior. Customizable layout options, such as disabling the x-axis range slider, help create a focused and streamlined visualization.
AI Analysis Request and Results Display
The dashboard formats the request, including chart images, for AI analysis. The prompt instructs the AI model to analyze the candlestick chart and provide a buy/hold/sell recommendation with detailed reasoning.
Images are encoded in Base64 format for compatibility with the AI model, ensuring seamless data transmission and processing. The AI's analysis, including the recommendation and reasoning, is presented in an organized and readable format, helping you make informed decisions.
Frequently Asked Questions (FAQ)
What is the core technology behind this AI-powered dashboard?
The core technology includes the Llama 3.2 vision model, Python libraries like yfinance, Pandas, and Plotly, and the Streamlit framework for creating interactive web apps. This combination enables automated data retrieval, analysis, and visualization for technical stock analysis.
How can I customize the dashboard to fit my trading strategy?
You can customize the dashboard by selecting different technical indicators, adjusting the AI model's prompts, and modifying the Python code to incorporate additional features, such as portfolio-level analytics or custom trading signals. The modular design makes it easy to tailor the dashboard to your specific needs.
Is this AI-powered dashboard suitable for beginners?
While the dashboard offers automated analysis, a solid understanding of technical analysis is recommended to effectively interpret the insights provided. It's a powerful tool, but it should be used in conjunction with your own knowledge and critical thinking.
Related Questions
How does the Llama 3.2 vision model analyze candlestick charts?
The Llama 3.2 vision model analyzes candlestick charts by interpreting visual patterns and trends. It identifies key formations, such as bullish or bearish patterns, and assesses the relationship between price and volume. By extracting visual features from the chart image, it generates a textual analysis that incorporates information on trends, technical indicators, and potential buy/sell opportunities. The model leverages its training on vast datasets of images and text to provide nuanced insights into the stock's price behavior.
What are the limitations of using AI in technical stock analysis?
While AI offers numerous benefits, it's important to be aware of its limitations:
- Data Dependency: AI models rely on historical data, and their performance can be affected by changes in market dynamics.
- Inaccuracy: AI/LLM technology is experimental, and outputs may contain inaccuracies or misleading information.
- Overfitting: AI models can overfit to training data, leading to poor generalization on unseen data.
- Lack of Context: AI may not fully understand the broader economic or geopolitical context that affects stock prices.
Therefore, it's crucial to use AI as a tool to aid in the research process, rather than blindly following the AI's recommendations.
Can this dashboard be used for automated trading?
This tutorial focuses on using the dashboard for analysis and decision support; it does not cover automated trading. However, with further development, it could be integrated into an automated trading system. Ensure thorough testing and risk management strategies are in place before implementing automated trading.
Related article
 How Fintech Companies Achieve Strong Return on Investment by Leveraging Data
A solid foundation of integrated data is essential for boosting return on investment in fintech marketing efforts. Credit: Getty ImagesStephen Williams, CEO of Marketing Evolution, explains why unified data represents a crucial missing element for fi
Bain forecasts US$100 billion SaaS market in agentic AI automation
Bain & Company has estimated a $100 billion market in the U.S. for SaaS companies leveraging agentic AI. The firm said this market stems from automating coordination tasks within enterprise systems.This estimate comes from the second installment in B
Kakao Mobility outlines Level 4 autonomous driving roadmap for physical AI
Kakao Mobility is planning to develop Level 4 autonomous driving technologies internally as part of its physical AI strategy.
At the 2026 World IT Show conference in Seoul's COEX, Kim Jin-kyu — vice president and head of Kakao Mobility's Physical AI
Related Special Topic Recommendations
Business
How Fintech Companies Achieve Strong Return on Investment by Leveraging Data
A solid foundation of integrated data is essential for boosting return on investment in fintech marketing efforts. Credit: Getty ImagesStephen Williams, CEO of Marketing Evolution, explains why unified data represents a crucial missing element for fi
Bain forecasts US$100 billion SaaS market in agentic AI automation
Bain & Company has estimated a $100 billion market in the U.S. for SaaS companies leveraging agentic AI. The firm said this market stems from automating coordination tasks within enterprise systems.This estimate comes from the second installment in B
Kakao Mobility outlines Level 4 autonomous driving roadmap for physical AI
Kakao Mobility is planning to develop Level 4 autonomous driving technologies internally as part of its physical AI strategy.
At the 2026 World IT Show conference in Seoul's COEX, Kim Jin-kyu — vice president and head of Kakao Mobility's Physical AI
Related Special Topic Recommendations
Business
 Best AI Competitive Research Tools for Small Businesses
2026 Latest Best Top-rated AI Competitive Research Tools for Small Businesses! XIX.AI has curated a highly powerful game-changing collection, updated weekly with rigorous real-world tests and detailed rankings. You can find a comprehensive free vs paid comparison to help you identify the must-try tools that boost your productivity and give you a competitive edge. Explore now to discover your perfect tool!
 9 tools
 xix.ai
Image editing
Photoshop AI Retouch Tools for Ecommerce Apparel, Skin Cleanup, and Color Consistency
xix.ai
Image editing
Photoshop AI Retouch Tools for Ecommerce Apparel, Skin Cleanup, and Color Consistency
2026 Latest Best Photoshop AI retouch tools for ecommerce apparel, skin cleanup, and color consistency! This top-rated curated list features powerful game-changing solutions that help you boost writing efficiency, streamline content creation, and achieve perfect visual results effortlessly. Each tool has undergone real-world tests through weekly updated rankings, complete with free vs paid comparison details. Backed by XIX.AI, it’s the must-try guide for anyone aiming to unlock your AI edge. Explore now!
10 tools
xix.ai
Prompt
Best AI Prompt Libraries for ChatGPT Workflows
2026 Latest Best Top-Rated AI Prompt Libraries for optimizing all types of ChatGPT workflows. XIX.AI has curated a powerful, game-changing collection that goes through rigorous real-world tests to ensure top performance. You can find detailed free vs paid comparisons and expert rankings to help you choose the must-try tools that boost your productivity and unlock your AI edge. Explore now!
11 tools
xix.ai
Education and Learning
AI Quiz Builder Platforms for Teachers, Tutors, and Cohort-Based Learning Programs
2026 Latest Best AI Quiz Builder Platforms for Teachers, Tutors, and Cohort-Based Learning Programs! XIX.AI has curated a top-rated list of powerful game-changing tools that go through real-world tests to deliver accurate rankings. These must-try platforms help boost writing efficiency, streamline content creation, and simplify quiz design across all learning scenarios. Explore now to discover your perfect tool for unlocking your AI edge in teaching!
13 tools
xix.ai
code
AI Pull Request Review Tools for GitHub Teams Handling Refactors, Bugs, and Security Gaps
2026 Latest Best AI Pull Request Review Tools for GitHub Teams are here on XIX.AI! This top-rated curated list showcases powerful game-changing solutions that streamline refactoring, bug fixing, and security gap detection across all team workflows. Enjoy a free vs paid comparison along with real-world tests and detailed rankings to help you find the perfect tool that boosts productivity significantly. Explore now to unlock your AI edge!
12 tools
xix.ai
Text-to-speech
Best AI Text to Speech Tools for Natural Voiceovers
2026 Latest Best Top-rated AI Text to Speech Tools for Natural Voiceovers are here on XIX.AI! This curated list features powerful, game-changing options that deliver crystal-clear voices for every use case, backed by real-world tests and weekly updated rankings. Get a free vs paid comparison to find the must-try solution that boosts your productivity instantly. Explore now to Unlock your AI edge!
11 tools
xix.ai

 Comments (4)
0/500
Comments (4)
0/500
![JuanLewis]()
Тема ИИ в анализе акций интересна, но не хватает данных о точности прогнозов и тестировании на исторических котировках. Доверять ли таким системам во время волатильности? 🤔 Лично я бы перед внедрением проверил на демо-счёте.
![OliviaJones]()
This AI stock analysis tool sounds like a game-changer! 🚀 I'm curious how accurate it is compared to traditional methods. Anyone tried it yet?
![RobertRamirez]()
This AI stock analysis guide is a game-changer! 🚀 Automating technical analysis sounds like a dream for traders like me who hate crunching numbers manually. Curious how accurate these AI predictions are compared to traditional methods. Anyone tried this yet?
![LarryAdams]()
This AI stock analysis stuff sounds cool, but does it really beat a seasoned trader’s gut? I’m curious to try it out! 😎
Unlock the Power of AI in Stock Market Analysis
Ever wondered how you can leverage artificial intelligence to make smarter investment decisions? Dive into this comprehensive guide on using an AI-driven dashboard to automate your technical stock analysis. Whether you're a day trader or a long-term investor, you'll find actionable insights that can enhance your trading strategy. From tools and customizations to potential benefits, we've got you covered.
Key Points
- AI-powered dashboards streamline technical stock analysis.
- They run efficiently on laptops with minimal code required.
- Customize analysis to fit your specific trading strategies.
- Utilize AI tools like Ollama and Meta's Llama 3.2 vision model.
- Essential Python libraries include yfinance, Pandas, and Plotly.
Disclaimer: This tutorial is for educational purposes only. Always critically evaluate AI outputs.
Introduction to AI-Powered Stock Analysis Dashboards
What is an AI-Powered Stock Analysis Dashboard?
An AI-powered stock analysis dashboard is a game-changer for anyone involved in the stock market. It uses artificial intelligence to automate and enhance the often tedious process of technical stock analysis. Instead of manually combing through heaps of data and trying to spot patterns, an AI dashboard does the heavy lifting for you, delivering quicker and more accurate insights.
Here's what you can expect from an AI-driven dashboard:
- Data Fetching: Automatically pulls stock data from sources like yfinance.
- Technical Indicators: Calculates key indicators like Simple Moving Averages (SMA), Exponential Moving Averages (EMA), Bollinger Bands, and Volume Weighted Average Price (VWAP).
- AI Vision Model: Employs AI vision models, such as Meta's Llama 3.2, to interpret chart patterns and offer informed recommendations.
- Interactive Visualization: Uses libraries like Plotly to create interactive charts, making it easier to spot trends and patterns.
- Customization Options: Allows you to tailor analysis parameters, including stock ticker, date range, and technical indicators.
These dashboards are designed to run smoothly on standard laptops, making them accessible to both novice and seasoned traders looking to enhance their investment strategies.
Benefits of Automating Technical Stock Analysis
Automating your technical stock analysis with an AI-powered dashboard comes with a host of benefits:
- Time Savings: AI processes data much faster than humans, freeing you up to focus on strategic decisions.
- Increased Accuracy: By minimizing human error, AI provides more reliable and consistent analysis.
- Enhanced Insights: AI can pick up on subtle patterns and correlations that might slip past human analysts.
- Customizable Strategies: Tailor the analysis to align with your specific trading strategies, whether you're into day trading or long-term investing.
- Portfolio-Level Analysis: Get a comprehensive view of your investment portfolio by analyzing multiple stocks at once.
By integrating AI into your trading, you can make quicker, more informed decisions, potentially leading to better investment outcomes.
Customizing Your AI-Powered Stock Analysis Dashboard
Expanding Functionality
You can significantly enhance your AI-powered stock analysis dashboard by adding features tailored to your trading needs. Here are some ideas to get you started:
- Integrate Additional Technical Indicators: Add more indicators like the Relative Strength Index (RSI), Moving Average Convergence Divergence (MACD), and Ichimoku Cloud to deepen your analysis.
- Advanced Charting Options: Implement heatmaps or 3D charts to visualize data in new ways, helping you spot patterns more quickly.
- Portfolio Level Analytics: Analyze your entire portfolio to identify broader market trends and correlations that impact your investments.
- Alert and Notification Systems: Set up automated alerts for specific technical conditions, such as crossing a moving average or reaching overbought/oversold levels.
- Backtesting Capabilities: Evaluate the performance of different trading strategies using historical data to refine and validate your approaches.
- Sentiment Analysis: Integrate tools to gauge market sentiment from news articles, social media, and other sources, giving you a more complete picture of market psychology.
- Machine Learning Models: Enhance AI capabilities with models like time series forecasting and clustering algorithms to group similar stocks or ETFs.
- Paper Trading Mode: Create a sandbox environment to practice new strategies without risking real capital, ensuring thorough testing before going live.
Step-by-Step Guide to Using the AI Stock Analysis Dashboard
Step 1: Setting Up the Environment
Before diving into the dashboard, you'll need to set up your environment. Here's how:
- Install Ollama: Head over to the Ollama website and download the installer for your operating system. Follow the instructions to set it up on your desktop.
- Run Llama 3.2 Vision Model: Open your terminal or command prompt and enter:
ollama run llama3.2-vision. This installs the Llama 3.2 vision model on your machine. Keep this window open. - Install Python Libraries: In a new terminal window, activate your Python environment and install the required libraries with:
pip install Streamlit yfinance pandas plotly ollama.
Step 2: Running the AI Technical Analysis App
With your environment set up, you're ready to run the AI technical analysis app:
- Save the Python Code: Save the provided Python code to a file named
ai_technical_analysis.py. - Run the Streamlit App: Navigate to the directory where you saved the file and run:
streamlit run path/to/folder/ai_technical_analysis.py. - Access the Dashboard: Streamlit will open your web browser to a local host address, displaying the AI Technical Stock Analysis Dashboard.
Step 3: Configuring the Dashboard
Now that the dashboard is up and running, configure it to analyze your desired stock:
- Enter Stock Ticker: In the configuration sidebar, enter the stock ticker symbol you want to analyze (e.g., AAPL, MSFT).
- Select Date Range: Choose the start and end dates for your analysis. The dashboard will fetch historical data within this range.
- Fetch Data: Click the "Fetch Data" button to retrieve the stock data from yfinance.
- Select Technical Indicators: Choose the technical indicators you want to overlay on the chart, such as 20-Day SMA, 20-Day EMA, Bollinger Bands, and VWAP.
Step 4: Running the AI Analysis and Interpreting Results
With your dashboard configured, you can now run the AI analysis:
- Run AI Analysis: Click the "Run AI Analysis" button to start the process. A spinner will appear, indicating that the chart is being analyzed.
- Review AI Analysis Results: Once the analysis is complete, the AI's recommendation and reasoning will be displayed below the chart. Use these insights to inform your trading decisions.
Remember, AI outputs should be critically evaluated, as they may contain inaccuracies or misleading information.
Pros and Cons of Using an AI-Powered Stock Analysis Dashboard
Pros
- Automates complex technical analysis tasks.
- Provides quick and accurate insights.
- Offers customizable analysis parameters.
- Enhances portfolio-level analytics.
- Runs efficiently on standard laptops.
Cons
- Requires an understanding of technical analysis for effective interpretation.
- AI outputs should be critically evaluated for inaccuracies.
- May require some programming knowledge for advanced customizations.
- Heavily reliant on the availability and quality of historical data.
Core Features of the AI Stock Analysis Dashboard
Data Fetching
The dashboard uses yfinance to automatically retrieve historical stock data for specified tickers and date ranges, ensuring your analysis is always up-to-date. This integration saves you time and effort by eliminating manual data collection.
Pandas is used for efficient data manipulation and organization, allowing for easy calculation of technical indicators and data preparation for AI analysis.
Technical Indicator Integration
The dashboard integrates several technical indicators to analyze stock price movements, providing insights into market trends and potential trading opportunities. These include:
- Simple Moving Average (SMA): Averages the stock price over a specified period to identify longer-term trends.
- Exponential Moving Average (EMA): Similar to SMA but gives more weight to recent prices, making it more responsive to new information.
- Bollinger Bands: Indicates stock volatility by plotting upper and lower bands around the SMA, based on standard deviations.
- Volume Weighted Average Price (VWAP): Calculates the average price weighted by volume, showing the average price at which a stock has traded throughout the day.
AI-Powered Analysis with Llama 3.2 Vision Model
The dashboard integrates Meta's Llama 3.2 vision model to analyze stock charts. This advanced AI tool can interpret complex visual patterns and provide insights that traditional methods might miss.
The Ollama API enables seamless communication with the AI model, allowing you to customize the AI prompt to adjust analysis parameters and request specific recommendations.
Interactive Visualization with Plotly
Plotly is used to create interactive candlestick charts, providing a visual representation of stock price movements over time. These charts display the open, high, low, and close prices for each period, making it easy to identify patterns and trends.
Dynamic indicator overlays allow you to overlay technical indicators directly onto the chart, giving you a comprehensive view of stock behavior. Customizable layout options, such as disabling the x-axis range slider, help create a focused and streamlined visualization.
AI Analysis Request and Results Display
The dashboard formats the request, including chart images, for AI analysis. The prompt instructs the AI model to analyze the candlestick chart and provide a buy/hold/sell recommendation with detailed reasoning.
Images are encoded in Base64 format for compatibility with the AI model, ensuring seamless data transmission and processing. The AI's analysis, including the recommendation and reasoning, is presented in an organized and readable format, helping you make informed decisions.
Frequently Asked Questions (FAQ)
What is the core technology behind this AI-powered dashboard?
The core technology includes the Llama 3.2 vision model, Python libraries like yfinance, Pandas, and Plotly, and the Streamlit framework for creating interactive web apps. This combination enables automated data retrieval, analysis, and visualization for technical stock analysis.
How can I customize the dashboard to fit my trading strategy?
You can customize the dashboard by selecting different technical indicators, adjusting the AI model's prompts, and modifying the Python code to incorporate additional features, such as portfolio-level analytics or custom trading signals. The modular design makes it easy to tailor the dashboard to your specific needs.
Is this AI-powered dashboard suitable for beginners?
While the dashboard offers automated analysis, a solid understanding of technical analysis is recommended to effectively interpret the insights provided. It's a powerful tool, but it should be used in conjunction with your own knowledge and critical thinking.
Related Questions
How does the Llama 3.2 vision model analyze candlestick charts?
The Llama 3.2 vision model analyzes candlestick charts by interpreting visual patterns and trends. It identifies key formations, such as bullish or bearish patterns, and assesses the relationship between price and volume. By extracting visual features from the chart image, it generates a textual analysis that incorporates information on trends, technical indicators, and potential buy/sell opportunities. The model leverages its training on vast datasets of images and text to provide nuanced insights into the stock's price behavior.
What are the limitations of using AI in technical stock analysis?
While AI offers numerous benefits, it's important to be aware of its limitations:
- Data Dependency: AI models rely on historical data, and their performance can be affected by changes in market dynamics.
- Inaccuracy: AI/LLM technology is experimental, and outputs may contain inaccuracies or misleading information.
- Overfitting: AI models can overfit to training data, leading to poor generalization on unseen data.
- Lack of Context: AI may not fully understand the broader economic or geopolitical context that affects stock prices.
Therefore, it's crucial to use AI as a tool to aid in the research process, rather than blindly following the AI's recommendations.
Can this dashboard be used for automated trading?
This tutorial focuses on using the dashboard for analysis and decision support; it does not cover automated trading. However, with further development, it could be integrated into an automated trading system. Ensure thorough testing and risk management strategies are in place before implementing automated trading.








 How Fintech Companies Achieve Strong Return on Investment by Leveraging Data
A solid foundation of integrated data is essential for boosting return on investment in fintech marketing efforts. Credit: Getty ImagesStephen Williams, CEO of Marketing Evolution, explains why unified data represents a crucial missing element for fi
Bain forecasts US$100 billion SaaS market in agentic AI automation
Bain & Company has estimated a $100 billion market in the U.S. for SaaS companies leveraging agentic AI. The firm said this market stems from automating coordination tasks within enterprise systems.This estimate comes from the second installment in B
Kakao Mobility outlines Level 4 autonomous driving roadmap for physical AI
Kakao Mobility is planning to develop Level 4 autonomous driving technologies internally as part of its physical AI strategy.
At the 2026 World IT Show conference in Seoul's COEX, Kim Jin-kyu — vice president and head of Kakao Mobility's Physical AI
How Fintech Companies Achieve Strong Return on Investment by Leveraging Data
A solid foundation of integrated data is essential for boosting return on investment in fintech marketing efforts. Credit: Getty ImagesStephen Williams, CEO of Marketing Evolution, explains why unified data represents a crucial missing element for fi
Bain forecasts US$100 billion SaaS market in agentic AI automation
Bain & Company has estimated a $100 billion market in the U.S. for SaaS companies leveraging agentic AI. The firm said this market stems from automating coordination tasks within enterprise systems.This estimate comes from the second installment in B
Kakao Mobility outlines Level 4 autonomous driving roadmap for physical AI
Kakao Mobility is planning to develop Level 4 autonomous driving technologies internally as part of its physical AI strategy.
At the 2026 World IT Show conference in Seoul's COEX, Kim Jin-kyu — vice president and head of Kakao Mobility's Physical AI

2026 Latest Best Top-rated AI Competitive Research Tools for Small Businesses! XIX.AI has curated a highly powerful game-changing collection, updated weekly with rigorous real-world tests and detailed rankings. You can find a comprehensive free vs paid comparison to help you identify the must-try tools that boost your productivity and give you a competitive edge. Explore now to discover your perfect tool!
9 tools
xix.ai

2026 Latest Best Photoshop AI retouch tools for ecommerce apparel, skin cleanup, and color consistency! This top-rated curated list features powerful game-changing solutions that help you boost writing efficiency, streamline content creation, and achieve perfect visual results effortlessly. Each tool has undergone real-world tests through weekly updated rankings, complete with free vs paid comparison details. Backed by XIX.AI, it’s the must-try guide for anyone aiming to unlock your AI edge. Explore now!
10 tools
xix.ai

2026 Latest Best Top-Rated AI Prompt Libraries for optimizing all types of ChatGPT workflows. XIX.AI has curated a powerful, game-changing collection that goes through rigorous real-world tests to ensure top performance. You can find detailed free vs paid comparisons and expert rankings to help you choose the must-try tools that boost your productivity and unlock your AI edge. Explore now!
11 tools
xix.ai

2026 Latest Best AI Quiz Builder Platforms for Teachers, Tutors, and Cohort-Based Learning Programs! XIX.AI has curated a top-rated list of powerful game-changing tools that go through real-world tests to deliver accurate rankings. These must-try platforms help boost writing efficiency, streamline content creation, and simplify quiz design across all learning scenarios. Explore now to discover your perfect tool for unlocking your AI edge in teaching!
13 tools
xix.ai

2026 Latest Best AI Pull Request Review Tools for GitHub Teams are here on XIX.AI! This top-rated curated list showcases powerful game-changing solutions that streamline refactoring, bug fixing, and security gap detection across all team workflows. Enjoy a free vs paid comparison along with real-world tests and detailed rankings to help you find the perfect tool that boosts productivity significantly. Explore now to unlock your AI edge!
12 tools
xix.ai

2026 Latest Best Top-rated AI Text to Speech Tools for Natural Voiceovers are here on XIX.AI! This curated list features powerful, game-changing options that deliver crystal-clear voices for every use case, backed by real-world tests and weekly updated rankings. Get a free vs paid comparison to find the must-try solution that boosts your productivity instantly. Explore now to Unlock your AI edge!
11 tools
xix.ai

Тема ИИ в анализе акций интересна, но не хватает данных о точности прогнозов и тестировании на исторических котировках. Доверять ли таким системам во время волатильности? 🤔 Лично я бы перед внедрением проверил на демо-счёте.
This AI stock analysis tool sounds like a game-changer! 🚀 I'm curious how accurate it is compared to traditional methods. Anyone tried it yet?
This AI stock analysis guide is a game-changer! 🚀 Automating technical analysis sounds like a dream for traders like me who hate crunching numbers manually. Curious how accurate these AI predictions are compared to traditional methods. Anyone tried this yet?
This AI stock analysis stuff sounds cool, but does it really beat a seasoned trader’s gut? I’m curious to try it out! 😎