


 Home
HomeChartGen AI



Helps TikTok sellers, brands, MCNs, and TAPs discover winning products and find creators.

HelpLook is an AI-powered all-in-one knowledge base tool that helps businesses quickly build knowledge bases, help centers, and...

Your AI Workspace

302.AI is an enterprise-grade AI resource platform with pay-as-you-go pricing, API access to a full range of AI models, and ready-to-use online applications.

剧火AI — AI Screenwriter + Director, a One-Person Short Drama Studio In one sentence, what is it?
ChartGen AI Product Information
What is ChartGen AI?
ChartGen AI is an online AI-powered chart maker that instantly analyzes your data and turns natural language descriptions into professional visualizations. It supports nine chart types—including bar, line, pie, area, scatter, heatmap, combo, waterfall, and funnel—auto-detects fields and calculations, and applies pre-designed templates and color themes. Charts can be linked to live data, exported as PNG, SVG, or PDF, and published to dashboards. Advanced enterprise features, exports, and team collaboration are available through Ada.im. Designed for speed and simplicity, ChartGen enables analysts and business users to create polished charts without any coding.
Who uses ChartGen AI?
- Data analysts
- Marketing managers
- Product managers
- Finance teams
- Business executives
- Researchers and academics
- Consultants and agencies
- Small business owners
How to use ChartGen AI
- Step 1: Visit https://chartgen.ai and click 'Start Creating' or upload your CSV or Excel file.
- Step 2: Allow the AI to auto-detect your columns, or map fields manually if you prefer.
- Step 3: Enter a prompt in plain language describing the chart you need (e.g., "monthly revenue line chart by region").
- Step 4: Review the AI-generated chart and adjust aggregations, labels, colors, or templates as needed.
- Step 5: Optionally connect live data sources to keep charts updated automatically.
- Step 6: Export your chart as a PNG, SVG, or PDF file, or publish and embed it into dashboards or presentations.
Platform
- Web browser
ChartGen AI's Core Features & Benefits
Core Features
- Chart creation from natural language prompts
- Upload CSV/Excel files or paste data directly
- 9 professional chart types
- Automatic field and aggregation detection
- 12+ color themes and ready-made templates
- Live data synchronization
- Export as PNG, SVG, or PDF
- Publish to dashboards with embed options
- Enterprise security (SOC 2 compliant, encryption)
Benefits
- Build charts in seconds, no coding required
- Deliver consistent, presentation-ready visuals
- Cut down manual reporting time
- Easily customize with templates and color palettes
- Scale for teams and enterprises via Ada.im
- Securely handle business-sensitive data
ChartGen AI's Main Use Cases & Applications
- Marketing campaign performance reports
- Quarterly financial and revenue dashboards
- Product metrics and user analytics visualizations
- Survey results and research data presentations
- E-commerce sales breakdowns
- Operational and HR analytics snapshots
ChartGen AI's Pros & Cons
Pros
Extremely fast AI chart generation (under 5 seconds on average)
Natural language prompts remove technical barriers
Extensive library of templates and color themes
Supports live data sync and meets enterprise security standards
Includes a free tier (50 charts per month at no cost)
Cons
Web-only platform—no dedicated mobile or desktop applications
Less interactive analytics compared to full business intelligence suites
Advanced exports and some features require an Ada.im account
Not an open-source solution
Offers less deep customization than tools like Tableau or Power BI
ChartGen AI Pricing
Offers free plan | YES |
|---|---|
Free trial details | |
Pricing model | Freemium |
Credit card required | No |
Lifetime plan available | No |
Billing frequency |
For the most current pricing, visit: https://ada.im
ChartGen AI FAQs
What file formats does ChartGen support?
ChartGen accepts CSV and Excel files (.xlsx, .xls) for upload and also lets you paste table data directly into the platform.
How do I generate a chart with the AI?
Upload your data, then type a natural language prompt describing the chart you want. The AI will automatically choose fields, calculations, and a suitable chart type.
What chart types are available?
ChartGen offers bar, line, pie, area, scatter, heatmap, combo (bar+line), waterfall, and funnel charts.
Can I customize colors and templates?
Yes. ChartGen provides a collection of color themes and templates, along with a color picker to create custom palettes.
Is there a free plan?
Yes. The free tier includes 50 AI-generated charts per month with access to all chart types.
How can I export my charts?
Charts can be downloaded as high-quality PNGs. Additional formats like SVG and PDF are available through an Ada.im account.
Does ChartGen support live data connections?
Yes. ChartGen can connect to data sources for live synchronization and automatic chart refreshes.
Who is ChartGen for?
ChartGen is designed for analysts, marketers, product managers, finance teams, researchers, and anyone who needs fast, professional visualizations.
Is my data secure when using ChartGen?
Yes. ChartGen processes data in real-time, uses HTTPS encryption, and adheres to enterprise security standards, including SOC 2 compliance.
What is the relationship between ChartGen and Ada.im?
ChartGen is a chart-generation tool developed by Ada.im, which provides broader AI data analysis and enterprise capabilities.
ChartGen AI Company Information
- Ada.im
- https://chartgen.ai
- https://x.com/ada_dataanalyst
- https://www.instagram.com/chartgen_ai?igsh=a3g0N2RqMHA0Z3Fs
- https://www.linkedin.com/company/ada-im

How do I install it?
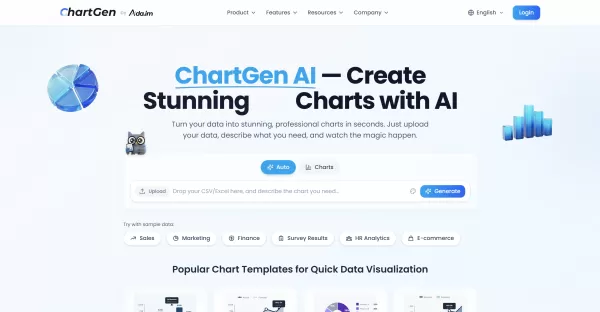
ChartGen AI Screenshot

2026 Latest Best Manga AI Background Generators Ranked Top-Rated! This curated collection showcases powerful game-changing tools perfect for creating high-quality chapter backgrounds, book covers, and promotional art. Every option has undergone rigorous real-world tests to ensure reliability. Get a free vs paid comparison along with detailed insights. Explore now to discover your perfect tool and unlock your AI edge in manga creation.
 6 tools
 xix.ai
2026 Latest Best Top-rated AI Object Removal Editors for portraits travel product shots! XIX.AI curates a powerful game-changing collection regularly updated with weekly rankings. These tools offer real-world tests to help you quickly remove unwanted elements, boost content quality, and save tons of time without compromising results. Must-try for anyone aiming to unlock their AI creation edge. Explore now!
10 tools
xix.ai

2026 Latest Best Top-rated AI Text to Speech Tools for Online Courses are curated by XIX.AI based on rigorous real-world tests and weekly updated rankings. These powerful tools help creators deliver crystal-clear audio content effortlessly, boosting writing efficiency and streamlining course production. Check out the free vs paid comparison to find your perfect fit. Explore now to unlock your AI edge in online education.
10 tools
xix.ai

2026 Latest Best Top-Rated AI Blog Title Tools for Higher Click Through Rates! XIX.AI has carefully curated a powerful, game-changing collection of top tools that go through rigorous real-world tests. You’ll find a free vs paid comparison, weekly updated rankings, and detailed insights to help you boost your blog’s traffic efficiently. Must-try options are highlighted to help you unlock your AI edge. Explore now!
10 tools
xix.ai

2026 Latest Best Top-rated AI Task Routing Tools for Support Workflows! XIX.AI has curated a highly powerful game-changing collection of must-try solutions, all undergoing rigorous real-world tests and updated weekly. These tools streamline workflows, boost productivity, and help teams deliver faster, more efficient support. Explore now to discover your perfect tool and unlock your AI edge!
17 tools
xix.ai
2026 Latest Best Top-Rated AI Citation and Paper Summary Tools Curated by XIX.AI. Get powerful game-changing solutions for quick content creation, improved writing efficiency, and boosting productivity. We offer a free vs paid comparison along with real-world tests and weekly updated rankings to help you find the must-try tool that fits your needs perfectly. Explore now to Unlock your AI edge.
10 tools
xix.ai


